Pages


Thursday, March 31, 2011

03.31.2011

March Average was $35.85 and the second highest ever!


Top Five Monthly Average months!


1. January 1980 - $39.28
2. March 2011 - $35.85
3. February 1980 - $35.60
4. February 2011 - $31.04
5. December 2010 - $29.44


It might be possible that April will be the best month ever as far as monthly average is concerned, or it as least now a viable target as silver closes the month a hair below thirty-eight dollars per ounce. Currently when silver is making new highs the term being used by myself and others is that of a "31 year high" as Silver reached over $50.00 per ounce in January of 1980. After this the word will become "All time high" by some people and myself I will use the term "Nominal High" as there is a lot of leg room to get back to previous areas when we adjust for true inflation that this world has endured over the last century or so. In the 1800s Silver was $1.293 per ounce which means it is up under 30x from where it was selling many generations ago. Considering the average salary in 1910 was $750 and we multiply this by 30 the total brings us to over $20,000 and with the average at over $40,000 in 2009 the wages have went up a total of over 50 times in less than one hundred years. The flaw here is that the average wage and median wage have a major disconnect because the rich bring the average much higher as the star celebrities, sports athletes and CEOs keep on bringing their riches in. Also this tells me that I am right that the USA dollar is closing in on losing 99% of its value since it begun almost a century ago. For this to happen you have to lose 100x the value on currency. 100 times the $1.293 number means silver over $129 per ounce which seems to be the fair value for silver these days. Have a long way to go, but have found no reason yet to see any long term topping action or an end to the brutal inflation we've had for many decades.


MONTHLY CHART


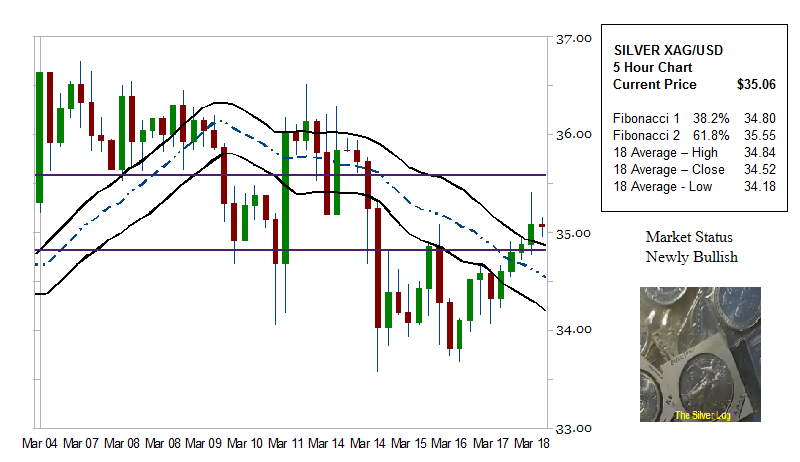
This is a nice looking chart and currently the price action is well above the 18 month average of highs, lows and closes in a large bullish trend with more upside potential. The reason the potential is very big is because of the last twelve candles or the last year. Last year at this time we were range bound from the $17.00 to $19.50 marks and broke the resistance in August of 2010 and started the bull market in September with a nice move higher. The final four candles gave us a nice time consolidation for the short term and now has broke resistance and is in the process of breaking out. All I want to say is that the market is not in need of correcting any further at this time and we need to have a much larger gain for me to see that "This chart is up too much right now." By shorting silver or selling because of this reason of the chart looking like it is too high is that of gambling and fighting the trend. If you profit take a little or if you hedge your bets a little, then those strategies usually can work well when you implement this within' your strategy.


QUARTERLY CHART


I stated in the monthly chart it was not over extended because it had the one candle time correction in January and a breakout since. This one is starting to become overextended. This quarter was the ninth straight positive one with an increase as well as the third straight significant gain. I would feel as if betting against Silver here is like betting against the hottest baseball or football team going whom has a nine game winning streak and thus the reason why they say in stock trading; "The trend is your friend." The path of least resistance is higher for this market and because it is only starting to become overextended this tells me we can easily see the gains continue or at least we are going to need those small gains getting above $60 aprx per ounce before it can go parabolic. The reason for this is when markets are up way too much or are very over extended then you would expect not only for volatility to rise, but for either topping action of some sort or a major up move as the psychology of resistance not being acted as such when it is supposed makes the gains go to parabolic levels. The same can be said for down moves when support is not found at key areas, but this market is bullish and we will use the example that we see here. Once again another reminder that the market was $50.00 back in 1980 and thus this gives us price history data to clarify higher gains and by extending the math further a dose or tablespoon of inflation here and there shows much higher upside potential.

Not sure yet if this is the last post for the day for the blog. There will not be a video until tomorrow and this weekend I want to talk more on the gold to silver ratio as well as the palladium to silver ratio. Thank you for stopping by today.

Wednesday, March 30, 2011

03.30.2011

More Sideways Movements!


Another session of sideways movement for the market and this is very healthy. Markets can correct either through price or time and we are seeing how we have been moving sideways through time since we last went above $38.00 an ounce last Thursday. I live in a world where I believe there is no such thing as up or down too much in the regards that if a market is going higher and looks over extended does not been it has to sell off as well as the polar opposite on down moves when it looks like it is down too much. The same can be true for correcting through time. There is no such thing as correcting through time for too long, but the longer that one does move sideways the bigger the break(out)(down) usually is. In the first eight months of 2010 the market was in a sideways correction and it has a huge breakout to the upside, showing that because it was correcting for so long the odds favored a big move up or down. It has only been five days, which means on the daily chart (5 candles) that it is only starting to correct through time for a decent duration and the bias for the break is to the upside to the $40-$42 levels. This is only bias and remember to adjust to the message of the market. Because not much is happening the blog will be a quick one today. Tomorrow is the end of the month and quarter and should have some great stuff up then. Thanks again for stopping by.

Tuesday, March 29, 2011

03.29.2011


VOLATILITY


Update 352pm EDT - The volatility has remained low for the intermediate term trend as shown on this chart. The way this chart measures the volatility is by taking the percentage moves from top to bottom and conducting a series of averages. This particular one was done by taking the 30 period average and the 120 period average and adding those two numbers together while multiplying it by a number to give it an index number that looks good. The number 10 or 15 or any other number is not important, but what is important is the increase. A move from 10 to 20 is the same as one from 28 to 56 and thus the increase levels is what will give it the importance. Because of the low volatility this tells me that if we have a breakdown on this trend it will probably be a viscous one that can see a $1.50 drop in a few hours and thus bring this volatility chart up to 15 or higher. That is one scenario, as another way of looking at this is that because the volatility index seems to be dropping key support that we can have a low volatile rally that will bring us to $40 in a few days. Also this could signify that the market needs to correct more through time as the moving averages of twenty days and beyond for silver are still in need of a correction some time.

The reason for this indicator mainly is to see how this gauge works when the comex problems occur in big levels or anything else that is setting these markets wild to see how wild this will become. I have stated before that in 1980 the moves silver endured were very viscous and in extreme volatility. At the end of March the LBMA reported around a dozen closes of around 8% or 9% either up or down and many over a dozen percent. When we start to see more seven, eight percent days occur both for wild up and down moves, this indicator will pick up on it and we will be starting the next cycle and this should result in many days of this high volatility where a blow off top would seem likely. This could mean a move to $94 on a Sunday night might get crippled to $82 in a few hours and this would be the top. Your either a genius, lucky or on the inside if you can call tops this amazing and be right every time. For now this is an intro to this chart with an expectation for this chart to get out of control later this year.


Update 11:39am edt - This pattern is the descending triangle which is matched up with fibonacci support that was previous support and resistance. Watch out for the potential fake out causing either a bull or bear trap as I have noticed on many past occasions when a trend like this occurs you can often see a major break below support and then shake some people out and then have a major up move. Vice versa also when it breaks resistance and then falls back below which would follow a fast move lower. $36.64 area is the key number I'd like to see this hold any pullback from here. If we breakout the likely scenario is that it can find a way to correct on a breakout level by trading in that area for more than a couple of hours or a nice retracement back to support after it breaks. The next significant fibonacci level is $35.32 and thus the must hold for the short term to avoid any bearish sentiment for this time frame. The volatility however is low. This should change however as it finishes it's D-Day decision for either an up or down move that should happen very soon.

Monday, March 28, 2011

03.28.2011

Another Consolidating Session


1113pm EDT Update - The market seems poised for that D-Day decision I have been talking about and its going to happen very soon. Most likely a move the lower fibonacci number on the image of $36.74 will be played as support. Thats the level that must hold for the dead cat bounce short term rally today to not be a failure. This is very short term analysis, and what this means long term is that we are on the top end of the trend line more than we are on the bottom. The reason i chose that bottom was because it was the resistance from where the line starts at the same descending rate of the resistance level. If I had to choose another one it would be lower based on the original lows on this chart. This also means that we are about four percent away from our highs and thus the retracement for a price correct really hasn't begun yet. If however we do find support at the $36.74 area or greater and make it past the resistance level of $37.24 that was hit three times today and hold above it for more than four or five hours, then I would be convinced the next leg higher is going to occur either this week that could run into next week. As I sign off, the market is holding so far at the $36.00 area and it's exactly where the five and one day average is and thus fast moves come when we are in these indecision moments. Thanks for stopping by the blog today. Read below for earlier days action and inflation adjusted video.

9:25pm EDT Update - Silver at $36.88 is holding below the five and one day moving average. It's only a shade below it right now and it has not been clear yet if this area was going to be resistance for a leg lower or be support and the correction in the intermediate term to be over. Previous support was $36.45 and currently the twenty day average is at $35.62 and it is rising as key levels for potential support if this is in fact resistance. The market is showing more signs of giving many neutral messages in what is already a very healthy bull market. Until then the downtrend line is what will be needed to be taken out to nullify this 4 day bear market.


Update 5:25pm EDT - The market closed with a smaller loss than Gold had. It's not often that when both metals go down you see silver outperform the Gold, but this happened today. Usually when this happens it is because the percentage losses were tiny and this was the case today, but the gold to silver ratio keeps going lower as more people are preferring silver over gold. I think a correction like this is very healthy for the silver market and looks poised to have another breakout. Until the trend does something to convince me otherwise, I will keep on looking at up moves in silver. I don't see a 100% gain in a few months being all that large off a move when i consider the past volatility this metal has occurred in the past as well as the level of manipulation that was done from 1980 to current. Of course because of the manipulation which is still active a move lower would not shock me right now, but I would not expect it (YET).


Update 4:30PM EDT - Youtube is not allowing me to upload and for 2 hours I have tried to get a video out, and its not working. I'll keep trying


11AM EDT UPDATE - The five day moving average was small support earlier and then fell below this level earlier this morning. Since this point we are now in a "D-DAY" style moment now as the rising five day moving average needs to either use this point as support and move higher and thus making the breakdown below $37.00 become a bear trap, or the one day is resistance with the five day and a new leg coming lower making this market very choppy. The one and five day averages are moving together and the price action being stuck in the middle is why I call this "D-DAY" and often times major volatile moves can result from these kind of patterns.

When I woke up this morning, CNBC had stated that it was the dollar being strong that has made the prices of gold and silver head lower and I seen on the ticker that UUP (Dollar ETF) was up two cents and thus the index was hardly up at all. Hearing this makes me very sick or at least I think to myself "I've had enough of this bullcrap" as the story doesn't make sense not only because the dollar has no intrinsic value but a baby step move in the USA currency is the reason for the move lower? What they won't say is how the market makers are manipulating the price to whichever way they find fit and this I guess would not be prudent to mention to the people as they try and hold their ponzi scheme a float.

A video should come out this afternoon.

Friday, March 25, 2011

03.25.2011


The comparison to 1979 to today is very much in play right now as the market is breaking out similar to how it did 32 years ago and if this continues there is much more upside potential along the way. This weekends blog posts will be very light and a new update will appear on Sunday, but it will also be very brief and to the point. Have a great weekend everybody and take care.

Thursday, March 24, 2011

03.24.2011

Silver breaks $38 before it falls a dollar


Update 12:00am EDT

In the video I stated this is a battle between the five and one day average. On the short term the path of the least resistance is definitely higher because it is holding with higher highs and making an ascending triangle with an uptrend line the last few hours and the one day average as resistance. The two levels given out that made the highs and lows today have not been taken out and that means fibonacci remains 37 and 67 cents on the $37 dollar handle and normally what happens on a breakout would be a move to the $37.67 level where it can try to find some support either by correction through time within' the fibonacci level or come back to the key support which is where we are now at around $37.45. Then on a breakout after that then I would expect a test of the previous high earlier today above thirty-eight and because of the current trend a move towards $40 for another leg higher would be expected as the trend is your friend. However, on the down side if this trend breaks the support is $37.37 and if this gives in the test is the previous low and breaking that is is both the five day moving average and then the $36.00 area.


The day ended with gold and silver having a similar down day of around one half percent. The retracement gold had today sent its price action to the five day moving average whereas the silver market went in between the one and five day average shown on this chart. Where we go from here is anyones guess and if we go lower on this I would peg the five day average as support as well as the previous resistance around $36.50.

Wednesday, March 23, 2011

03.23.2011

Silver breaks above $37.00 and 800mg of Gold


$1.00 gain now under 3%

Silver at $50 would make a one dollar gain worth 2% and at $100 would be 1%. This makes each dollar gain, worth a little less as it grows exponentially. For now, the trend is at a nice level higher right now and it did break well from the one day average and had one leg higher. The resistance level was given as early as Sunday when I placed an image for upside targets to reach $35.96 and then $37.36. The $36 level as we can see on this chart was resistance and became support for a decent amount of time making it a nice hit. The second is the current one which as been a small hit at least with the consolidation that it is going through. If this level breaks the next upside target is $39.70. Lets wait and see how we settle at this significant point. Markets can correct through time, which is what happened with the $36 level and is looking the be the case as I write this in the late afternoon. They could correct through price and if this is where we start a 3-5% down trend then this would not be a surprise what so ever and which means $36 is now projected support on any moves lower. This chart is over extended and still requires it's first five day test and because its over extended from the average, it can take a few days for a test some times.
Volatility has been very low and because of this, it makes me feel inclined to view this as another leg higher in the next few hours/days until this chart can settle out. It is designed like a VIX where it can only stay high and low for a period of time and thus when its at the upper band it will have to go lower within' time as is the case with lower volatility. This means the moves in each hour has small moves then they did before and thus you are getting eight cent moves in an hour in comparison to ten or twelve a few weeks before. The general synopsis on this is with lower volatility it means higher prices for silver as well as I would expect that the increase of volatility will continue with the higher prices and thus when this chart gets at least to 13 or 14 for a new high in silver. Then the prices should making this chart go back to the top end of the range.

Direction from 52 week high/low


When the chart is in the area or at the 0% level, this means new 52 week highs and lows are being put in. We made another new 52 week high today by going over $37.00 with more on the horizon. When we look at the moves on the chart we rarely ever make a new 52 week low by that of breaking support and rather this low gets taken out because of time. The 52 week low is currently $16.94 and will stay below $18.00 until August giving reason for a big move on the upside. This is the furthest silver has been from their 52 week low this millennium. For the downside there was only one occasion that the market had a decent fall on here, which was 2008 when it went from $21 to $8.


Gold to Silver Ratio update


A break below 39 on the gold to silver ratio as it is now over 800mg of Gold for one troy ounce of silver. There isn't many whom would consider the 800mg price and I could very easily state its over 0.8 grams now as another price for the ratio. Historically the ratio is sixteen to one and there are many whom consider it should be much lower than that because of the limited supply of silver versus gold as well as the uses that silver has in comparison to gold. We are seeing Gold barely up for the year right now and with Silver closing 2010 at $31 per ounce it seems safe to say Silver is doing fine in 2011 with gains of around 20% this year alone. This is silver gaining in real money as gold seems to be the best measure of currency. My prediction is for the gold to silver ratio to keep on falling not only to the 16 level, but even lower and possibly a test of the par value of 1 to 1. Before we get there, I would expect a decent dead cat bounce on the ratio where the market gains a decent amount before ultimately going much lower. An example of this might be seeing the ratio go to 20 to 1 and then back up to 35 to 1 before having a test of the 10 to 1 level. It's also to safe to assume that when the ratio goes higher that both gold and silver will sell off with major percentage moves in silver making this to be the case. If Silver tops at $85 and falls to $50 then I would guess that ratio would meet up at around 20 to 1 when silver is $85 and when the fall to $50 occurs the ratio could be 35 to 1. Guessing tops and bottoms can be a fools game and what I mainly want to point out is that the silver rally will have a correction at some point, and all this is will be a "best guess" for silver to come here and have a correction. It's better if you are selling silver based on the price going much higher into gold for the obvious reason that you don't want to be stuck with those fiat debt notes if you time your sale as the currency explodes. This way if the markets head lower you can sell back your gold for silver and in return get a few more ounces of silver then you previously had and if the markets keep going higher and you are wrong with a silver top, then at least you have some gold that is safe for a currency collapse and should gain a little on top. I will continue to adjust the message of the market, but it's only a possibility/probability for myself to sell a few ounces of silver for gold as it starts to approach above $70 per ounce. I'll keep you posted.

LunchTime Trade - 5second Line Chart


This is why the breakout was an easy call!

1 - The volatility was very low. The highest point on this range was $36.97 and the lowest was $36.87. This means over 45 minutes we were seeing a 10 cent range or less than one third of one percent. This doesn't favor much for the sellers


2 - Where did we come from? Where do we have the potential to go? This is a line by Brian Shannon whom I quote on many occasions and I do because he is very smart and a great teacher and the answer is we had made new highs breaking $36.76 from earlier. Therefore after a big run the market is trading sideways (aka bull flag or correcting through time).

3 - Hourly Volatility that was shown earlier on the blog is light and it most likely will have the pattern of highs and lows on the silver chart end during an increase of volatility. Most likely a good high volume/volatile push higher will give this market an area where it can be a good top for a few days. I don't think so now

4 - The charts shown higher highs from the original one of $36.87 and near end of this chart on many occasions the market took decent dips lower it was brought back with higher movements. Had you played this from a technical level you want to see it break $36.97 which it had done and thus made great gains.

Tuesday, March 22, 2011

03.22.2011


Silver holding well above $36.00


The market is holding well above both the 24 hour and 120 hour moving averages (or one and five day) as it is now battling the top part of the previous resistance level of $36.75. The failed move on the break below the five day moving average has pretty much now made a fast move to the upside. I say pretty much the slowest fast move I would allow is one up close to the previous resistance area and thus we are now close to $36.75. The chart is in need of a pull back at some time, but there is no reason that has to be at this point. The last correction was the move this morning breaking below $36.00 but they never stayed that low for that long. This is a correction and a failed move correction. The reason it failed was because it was able to get back all of its losses back and re-continue it's current up trend which could state that a fast move should follow or that of another leg higher to probable target of $37.34 pointed out earlier this week on the blog. If there is a pullback then I would look to see how it places with the rising five day moving average as well as the important 61.8% and 38.2% fibonacci levels and the breakout low is $33.69. To calculate take the difference and multiply the percent level and add that number to the 33.69 low.


Currently silver is starting the rally off better than the rally started in 1979 by doubling its value from the breakout bottom. $35.50 is double because $17.75 was the breakout bottom and it has been flirting with this level for a little while now where in 1979 they were playing around with 50% for the same amount of days. As cool as it maybe to say "We are kicking 1979's butt" based on performance the large task is still at hand to not only get up to the 200% level on the right hand side of the chart, but the 700% gain it topped at the $50 level back in 1980. One step at a time and this current time silver is thirty-six and a half and showing breakout signs. We are still a little way away from going parabolic today, silver did go parabolic and fast going from $8 to $18 in a short period of time which resulted in the gain on the chart. For this market to get to 200% to match the gains of 1979 we need to get a little over $50 per ounce ($17.75 x 3 = $53.25). To match the $50 high of 1980 we need a 700% gain on $17.75 or ($17.75 x 8 = $142).


This image shows the distance from the fifty day low and high on the silver market. Quite simply the Formulas are the following


50Low (Cur-Low)/Low
50High (High-Cur)/Cur


Correct me if I am wrong, but this formula should be designed to match the variances where if the market is down 50% it would work for 100% as the down moves are capped to under 100% to the downside.

Throwing this variable aside, by looking at this chart we can see that from the low there has not been many pullbacks. The pattern the way I see this is showing signs of another run higher as it is now less than two percent from the 0% bottom mark and when an index makes it to 0% this always means new highs and lows. The run up from the fifty day low is not as high as the previous gain was and a run to test the 50% barrier on this chart at least seems like a likely target. A test to this level can also mean that you break through you thus are now setting future bars. Regardless, this is the indicator that I think looks better when you combine using both the high and low variables. On Wednesday the 52 week high/low variables over the last few years will be posted at some point throughout the day.


The moving line chart on this month to date silver chart is a very simply made volatility chart. It is as simple as finding the percentage moves per hour in silver with the formula (high-low)/low and then taking the average of the last 30 and 120 hours/periods and add the two numbers together and there is your index. This tracks how volatile the moves are within' the market. They say the VIX is the volatility index and yet if the dow drops 500 points we should see the VIX go from 24 to 40 within' the day. If the Dow drops 200 points we should notice a move to the 30 area and if the Dow gains 200 points it might drop to 20. Therefore its designed to be a fear index and not volatility and thus not state it to go up on down moves and down on up moves. Regardless of the fact, we are seeing the volatility fall during this rally which would be more normal to have up moves on lower volatility.

Monday, March 21, 2011

03.21.2011

UP Over 2% today back over $36.00


Nice looking hourly candle chart here which has made some nice gains to approach close to it's previous resistance of $36.79 as the bull market continues so move in full throttle as Silver outperforms many other asset classes. The day started today with everything going higher in price from gold to oil to stocks and of course silver, but the white metal separated themselves from the others by continuing it's rally throughout the day. Stocks went neutral or sideways with a small basis to the downside as gold and oil sold some of their gains from the early session. Because of this the gold to silver ratio broke below 40 again as it's bear market continues meanwhile the price of silver in gold/mg is closing in on going over 800 and thus gaining on real money as well as its larger gains on fiat debt notes. The bias for the intermediate trend has been changed from Buy-Hold to Buy as I have been impressed with how the market has managed to get back above the five day moving average on the very first resistance test and thus making the previous breakout look as if is that of a failed move. If a fast move to were to finish that should mean a test at around $37.30 sometime this week and most likely early this week. Overall, the reason why both intermediate and long term trends are “BUY” is because we ain't seen nothing yet and we are only seeing the beginning stages of this massive upside explosion. The only thing stopping is some miracle in our currency actually having value and thus me being totally blind and clueless or the supply and demand factors to curve in the opposite direction. I don't like the chances of either one happening.


TREND LINE ANALYSIS VIDEO (No commentary)

Friday, March 18, 2011

03.18.2011


Nice decent open to the March 21 session. I was not happy to see its norm and for a gap higher as it does not make sense to me why a market should gap higher or lower like this if a market is closed. My chart shows no gap differences, but the move was about one percent on oil and silver up. Obviously some trading was done when markets were supposed to be closed. I think it would be better if the market did remain closed and it gaps open at 6pm New York time on Sunday night and it opens exactly where it closed. There might be fast volatility to start the day off, but at least we can be thankful for high frequency trading handling these paper trades and keep our full sarcastic trust that the comex will deliver all silver/gold requested as well GLD/SLV holders investing in an ETF that is fully backed by real metals.


Update - 4:08pm EST - Market is breaking out after the USA markets close for the public. This has been normal on Friday's where the last hour from 4pm to 5pm EST the market just surges to the upside. This rally is a break of a symmetrical triangle that has been in tact all day today and thus making almost every time frame to be in a solid bullish state and every time frame is bullish to one degree or another as of 4:09pm. Silver is at 35.18 and at levels not seen in six hours. The only people in 31 years in a losing position are those whom bought at the top and silver is only four percent away from this level.


Five hour chart for silver and a review of every (or most) time frames will be on this weekends video. The daily chart which is already bullish is now seeing its more shorter term time frame now move bullish. This is the 1/5th day pretty much as its the 5 hour data. With 24 hours in a day, I am not entirely sure. Within' this pattern the market is getting above those key moving averages. The moving averages are declining and this will change in the next candle as it will start to rise on the very next tick. When you are newly bullish you are also cautiously bullish which means you are in a stage where it's not that difficult to have a few moves to change the direction to neutral or bearish.


Update 2:45 - Check this video out. Gold is now available at ATM's


I have called this formation which ended the previous hour candle in a cat tail formation. Others call it a hammer. I guess this happens when you are self taught as I am for technical analysis. This cat tail/hammer is where you close near your open with a decent down tick as shown here. As of 2:22pm EST on the reporting of this formation the outcome is a symmetrical triangle on the 5 and 10 minute charts and down to 35.09. I give this a 75%+ shot on this to have another leg higher on this chart and extension on the 18 period averages. Be back later on.

Thursday, March 17, 2011

03.17.2011


Update - 10:20pm EST

Silver is closing in on $35.00 again as it is now making big moves above the key resistance level. I was able to make this chart with 50 candles that has the key fibonacci levels as well as the 18 period moving average. It has the high average, the low average and close average. When looking at this daily chart it has found support very nicely at the 18 day low average and the average is still in a rising format keeping this in a bullish state. This weekend i'll get out nine of these charts that include the 1 minute, 10 minute, 60 minute, 5 hour, daily, weekly, monthly, quarterly and yearly. Observe the market on all time frames using 50 candles, two key fibonacci lines and the 18 period average.

Flat day today for metals


Not much to report today as the gold and silver markets are staying neutral on the intermediate time frame. My personal bias is that the markets will continue to go lower and thus have a test on the $31-$32 handle for silver, but this is only an educated guess. $34.00 is big support within' the silver range and a break below the $33.50 previous range should result in a fast move lower most likely to $32.50 and a fast move would be that of a few hours to make it lower. This is very normal for the silver market to have these sort of events take place within' the paper silver market. The ultimate outcome is still not in doubt by any means and that is when you purchase real physical bullion (or scrap) silver that you actually have silver, and if you have a $20 piece of paper that is known as 'money' or 'currency' that you have a piece of high quality paper that weighs one gram with very little intrinsic value. My local dealer today stated that there is going to be bad news that he can't let go of any of his maple leaf bullion for any less than $44.00 and this is find as great news. It shows you that even though the prices are neutralizing in this $34.00 area that they can still pop a ten dollar premium on this. When I mention the disconnect from paper to physical this is what I am referring to. This is where you have much higher premiums because of the real supply and demand and not the phony price action on the paper markets. This tells me that if we have that move to $31-32 area that it should have a nice bounce in this area or it will not even go this low to begin with. If it breaks below $30 per ounce on paper than the disconnect will even grow larger. In march of 2008 when Silver was over twenty dollars I was buying Maples for $25.00 from dealers and then the price plummeted to twelve Canadian fiat debt notes. It was a challenge at this point to even see twenty dollar prices at this time frame because most dealers and silver traders knew the down move was phony. Then as the price of silver rose to eighteen dollars in the spring/summer the maple leafs were selling for $24 to $25 and 999 generic bars were $22. I wonder if the price were to go back to $18 and a 50% reduction of price what the prices would be? Would we see $25 maples? The answer is no you will not because the real physical supply and demand doesn’t allocate it to be true.


Update 8pm eastern - I have found a way to add moving averages to these candle charts. I found a little trick in doing so, and I don't have enough data yet for a 20 day average, but that would be getting close. This weekend another short candle video will be done using all the time frames from 1 minutes to the quarter and the 18 period average for each. This market continues to trade in its current trend and that is a range bound market. The range is a fifty cent range (1.5%) from $34.00 to $34.50. It has pierced a little above and below this, but thats where it stands. There has been more support tests than resistance tests and that gives more short term creditably to the sellers and only by a fraction. Given the current status of being at the top end of the range gives the opportunity to either break higher or at least make the bias neutral for credibility. It's below the five and ten day average and a test there will change the message of the market. When it eventually makes it up to the five day average, what you may want to observe is how much silver retraces from this level. If it can make it back 38.2% and show some strength moving forward, these are often the moves that change trend direction.

Wednesday, March 16, 2011

03.16.2011


Silver breaks even while stocks get hammered!

The previous resistance area was roughly thirty-four fiat debt notes and today support is roughly thirty-four fiat debt notes. The market remains neutral over the last couple days in its primary intermediate trend of lower (last week or so) within' the primary trend of higher (long term). Breaking the lower band should give us a test in the $32.50 area and the upper band would be a test back above $36.50 of previous resistance. I used the word fiat to remind people that the price in which you are accustomed to with silver is that in fiat dollars which is best summarized as in money not backed by any real asset(s). The word fiat is an adjective which is used to describe a noun and should only be used when the description is needed for the reader or listener. It would be very pointless to say something like "I am going to run some wet water for the bathtub" with the word wet being the adjective. This is because this person should know that the water is wet and thus it is not needed. If I state a line like "Would you like a red apple?" with the word red being an adjective then that would make sense because it could be a green apple. The explanation for the word red makes sense. I know a lot of the people whom come to this blog know the currency is fiat and backed by nothing and that I am really more than anything just preaching to the choir but because there is new people coming aboard every day as well as not many humans in general understanding currency I feel its necessary. For if you avoid or not use an adjective that is needed than people will never know such a thing and when I was growing up I had no idea that our currency was backed by nothing, but I always wanted to find out. I found out over three years ago as the internet truth movement was starting to blow in full force and I realized the reason that the powers that be whom controlled the media for years intensionally missed this adjective was so that they could keep me dumbfounded and ignorant. I was for a while, but I am not anymore. Therefore I will not be shaken out of any sell offs unless there is good logical reason.


Short term the market is trading within' the fibonacci range which puts it level to neutral trying to find direction. The move earlier today where the market went above $35.00 and was not able to find support in the $34.50 area which would qualify this breakout to be a failed move. Often times when a failed move happens a fast move will occur in the opposite direction and the move thus far has not been big enough to be a fast move. Some people might claim the only reason that silver sold off from this level was because the stock market was losing over 200 dow points in a few moments. That maybe true, but at the same point the stock market could very easily continue it's down trend and silver to follow suit and thus completing the fast move lower. Finally if this fast move DOES NOT HAPPEN, then that would be a failure for it not to. Therefore if the $34.00 area can successfully hold then this could either result in the continuation of the sideways trend in between the key fiboancci levels or the big break higher. The long term trend has clearly stated that $50 per ounce test should be on the horizon and these moves where silver goes down 10-20% means absolutely nothing to destroy this trend and rather that of a correction on its journey northbound.


If you look at any main market it is very easy to notice a common thread. This thread is that some where in the summer of 2010 the markets bottomed. Whether this be the Silver bottom at $16.00 per ounce or whether it be the Dow Jones, Crude Oil, the price of cotton or anything else. All the markets are now topping together and we are seeing selling across the board. As I am typing this on the afternoon of March the sixteenth the Dow Jones is down 210 points for the day and silver is only up six cents or down eighty cents (over two percent) in around three hours of time. Overall Silver is holding up very well and the stats presented within' the image on the screen shows what the approximate lows and highs for these markets are and where they were trading around 2pm EST on this date. Silver has only given back 11.8% of its gains over this period of time and only Heating Oil can say that is has given back less. There are more other markets (yes I know this), but I wanted to track ones that Finviz covers that are big enough market. I missed out many other ones that have dropped more than one quarter of the gains over the last nine months or so. What this tells me is that this move down from close $37 per ounce in silver which is now testing the $34 level is only a dip and that silver is one of the strongest investment classes there is because of how well it is holding this. I still wonder what would happen if the Dow Jones crashes in nominal terms (this is a big if) what will happen to gold and silver. Will they find ways of holding their own, or will they sell of very massive? A pullback down to the $31/$32 area would be healthy and not make the physical versus paper silver market have that great of a disconnect. However, any moves that go well below the $30 level should cause such a case. The reason I say it is a big if for the markets to crash (lose over 35%) is because of inflation and printed money. When we had the crash of 2008 and the move that seen silver go from $20 to $9 in a few weeks, dealers were hard pressed to lower their prices that much. Many of them knew that the selling was not valid for the real supply and demand properties and thus many dealers were reluctant to reduce prices that much. On the way back up as Silver was back in the $18 area, I was able to buy nice generic silver for $22 and maples for $24 and thus a little over spot. Today the maples sell for $42 if the dealers even have any, but if we have a move back to $18 on the charts would I expect the dealers to sell generic for $22 and maples for $24? I doubt it and that is why the disconnect would happen.

Tuesday, March 15, 2011

03.15.2011


Everything is plummeting today!


Perfect support found this morning at the "MUST HOLD" level to keep this rally alive. This is the rally from the breakout that occurred a little under $32.00 per ounce on from late February. Everything was selling off today as gold was taken down as was oil and the stock indices. Wall Street gives many reasons for why these markets are behaving in the matter they are and for me this is Bull%R#$%. Ok, i don't want to swear, but it is obvious that it is the big wall street style world financial bankers that are doing this. For me to get out of Silver, I need to have the price move properly and there is much more room to the upside for this to be the case or some real bad fundamental news to get me out. Some example of bad news items would be examples like our currency not being fiat and us not being enslaved to debt. This one I highly doubt will ever happen as I highly doubt that the real supply and demand justifies lower prices and this is not the case right. There are several reasons to get out of silver including aliens coming from outer space and sending a billion pounds of silver our way. This would increase the supply so much the value of it would diminish. Well, it's a strong play for me to hold this metal when those are the realistic reasons for me to be cautious on a fundamental level.


Within' the gold to silver ratio the technical pattern shown on these charts is "The Double Bottom" on the Gold priced in Silver and a "Double Top" in the Silver priced in Gold. This is bullish for the ratio to go higher and bearish for silver priced in milligrams. If we end up having a test towards $31.50 that would be about a ten percent decline. It would be safe to state that if this were to take place that gold would also go down, but not as much. This would mean a possible move to the 43-44 area on the ratio. The trend on a technical and fundamental level is for the ratio to keep going lower, but ultimately if the powers that be in this world are able to bring much lower silver prices and actually execute the play then we will see moves over 50 to 1.


This comparison shows how much we are outperforming the 1979 rally from the same amount of days. To keep this a float then either a correction through time for three to four weeks would be needed to meet up with the 1979 level getting to the 100% area from their lows or it could retrace a little bit more where it can find a bottom and then keep on moving northwards. Then again in 1979 the first few months were nothing compared to what happened at the end which is very normal in these high fundamentally driven markets. To me it just seems very co-incidental that all these events are playing out as they are as the comparison that lead up until we came to this point was very similar. That is because in 1979 the market had already been in a bull market for seven years with some decent gains and a large time correction right before the breakout. This time it had the same thing as it rallied from the $4.00 level less than a decade ago and from 2006 to the 2010 it was correcting through time over the long term time frame. The range from this period was from $10.00 and $20.00 and if this comparison can stay active then that should result in 700% gains from the $17.75 breakouts in August which would be around $140/oz. The reason why the timing is so well as this would occur over the summer time frame as all this earth changes is possibly coming to a halt or the conclusion of. I personally hope that it does end this fall and the dollar will be a thing of the past as we wait for Santa to come down this years chimney. Time will only tell with this and when you "adjust to the message of the market" that is basically when you see new stuff happen and things not quite play out as expected then you can ask yourself what it means and where can you from here with this new information. Thank you for stopping by the blog today.

Monday, March 14, 2011

03.14.2011

Not much of a day for price action


SILVER ACTION


Within' the Hourly line chart we can see a nice hold above the five day moving average which is a great indicator. This area was not used as resistance today and more than anything the market stays range bound between $35.50 and $36.50 as it recaptured last weeks range. Markets can correct either through price or through time. Correcting through time means that it says in a sideways movement. If you look at any chart that has done this you will notice moving averages will reflect themselves into a correction as they meet up with the range. You will notice that the bollinger bands will reset correctly also. I am not as big of a fan on bollinger bands and MACD, but but many other people are and they seem to work very good. The candle chart for the same time frame (hourly) shows a symmetrical triangle. These usually result after a big up or down move and this case it was from the up move last Friday. These tend to result within' the current pattern more often and in this case that would be higher. Not sure what percentage of the time it would go higher, but it would be over 50% and probably under 60%. This doesn't mean too much for the long term traders, but will be heavily looked by many short term individuals.

The daily chart for silver shows a break of the trend of the last few days on the downward slope with today being a consolidation period. Being that Silver is only around two percent from their 31 year highs there is no reason to even think of being bearish until it can retrace more than 38.2% exponential. I should have known the formula a long time ago, but I don't and found it this weekend. The formula for fibonacci on an exponential level is the following:

low*((high/low)^618)
Low=$26.30, High = $36.75 --- 26.3 * ((36.75/26.3)^618) is $32.34 and thus any retracements we have moving to this area I would expect to be guilty until proven innocent and thus having a bounce from the level

Gold and the Ratio
As well as the current economic depression


The daily chart for gold shows its consolidating it's gains nicely but more over in a range from $1410 to $1435 with a few pierces (small hits) above and below this level. Not performing as well as silver but holding up. It seems more clear to the day that we are currently living in a depression and if its silver as your main value of wealth it looks to be a deflationary depression. This means the times suck and the economy is getting destroyed with prices of goods being cheaper. Assume you bought silver before the $20 breakout or even anywhere below $30 and you observe the gas prices (or any other product/service) from the time you bought your silver to now. The amount of money you put into todays goods would make things much cheaper to buy. In Dollars this would be an inflationary depression because products and services are going higher. Gas prices are up and for the most part you can only hope the price hasn't changed in the last few months and that rising prices will not come any time soon. Even if they do go lower in prices as would be the case for technology for many years, this means even cheaper prices in silver as silver gains on fiat currency. Within' gold I think its going to be a depression because prices should stay a float with gold. This means if gas prices go up 40% then gold should go up around 40%. Time will only tell on this matter and over the last few months prices have been cheaper in silver and higher in dollars.


The trend is lower for the gold to silver ratio which was 39.88 at 5pm Eastern today (the time of the close on my page) and the silver to gold ratio using milligrams for gold was 784.4 at the same time and this trend is higher. Generally speaking silver seems to have bigger days on percentage numbers than gold. This means on a gold 1% move that silver should have around 3% most days either up or down. Therefore if the gold to silver ratio were to ever go back higher the likely scenario is that it will be because both gold and silver go lower. If Silver goes from $36 to $25 or loses one third than maybe gold may lose one sixth and go back to the $1200 area. Its unlikely that silver will rise and the ratio will go lower as that has been the trend for movements. If you play this ratio to go higher then essentially what you do is you short silver and buy gold with each position being around the same in nominal terms. If you play this with bullion then you would trade silver for gold with the plan on selling this back for silver. If sell 40 oz of silver today for one ounce of gold and the ratio moves to 50 then you could make the sale at this time and gain 10 ounces of silver on the trade. Of course that would be the result if you win. Stellaconcepts has recently pulled this trade off, which is one I do not like as the trend shows major strength for the ratio to keep going lower. The trend is your friend and by doing this play you are thus trying to call a bottom and fight the current path of least resistance in the hopes that it moves to your direction. With long term fundamentals stating a historical ratio of sixteen to one and when you look at the inventory and production of these two metals it should be a ten to one ratio. Finally the physical usages of silver states that silver has more value and thus there is much reason why this chart can come down lower. Webbot has reported that they expect this to hit parity for a very brief period of time and the webbot projections have been very accurate. The time frames are off with them, but what they say happens usually does. Therefore long term I would be expecting at least a test of the ten level and maybe even this year. It would take a major dollar collapse type of event to happen for this to be the case, which would be expected based on where we are today.

As far as a short term dip is concerned, I would want to see it go lower before guessing where a bottom is going to be. This level reach today was tested last Friday and the daily chart has much reason for another leg lower on the ratio and another leg higher on the silver priced in gold chart. I would start guessing (if I had to guess) when its around 810mg or 39 to 1 as it reaches a key fibonacci level. Even then I would not make this play as the risk versus reward does not look appealing. His upside targets were to either 50 or the 60 handle and from looking at the charts if we move higher I would look more towards 47 where we encountered some previous support as a key level to expect resistance as well as doing fibonacci calculations. But long term I am very bearish on the gold to silver ratio chart and thus bullish on the silver priced in Gold/MG chart.