Pages


Monday, February 28, 2011

02.28.2011

Twice Silver rallies from intraday sell offs


The silver market is holding up well still. With a high of $34.33, this means that only a few individuals are down on their paper purchase. This would be those whom bought this past week above our current close, and these people are only down less than two percent. Outside of this everyone is ahead over the last 31 years. Of course the disconnect from the bullion and paper market has not played out as of yet, but is getting closer. Is this the reason that both afternoon sell offs failed? I don't know, but it is holding up well. There was one sell off today that started around 1:20pm EST. This seen silver drop from $33.92 to $33.50. The buyers rushed back into the market and managed to top this market at a level of $33.82 just five minutes after the bottom. The selling would continue again as we seen the price plummet to $33.36 and again the buyers bought it back up as you can see on today’s intraday chart below. To enlarge on any image then please click on the image to make it bigger. Any of these images can be used in your video/blog presentations. If it is a large blog/video or you want something specific for your needs, please contact me at endlessmountain2008(at)yahoo.ca


FIBONACCI MARKS
LOW 31.70
HIGH 34.33

Key Fibonacci level to make this selling a week ago a failed move is $33.30.

This level was taken out last Friday and the selling moves today were right at this area. By having support here twice today and a nice move following this going higher, we will be in the process of having this selling that occurred at this time. A confirmation of this level means a very high chance of a test of $34.33 very soon. This $31.70 low is also finding support at the major $31.40 level I have talked about for two years now. This support is a large pierce above of over one percent, but this is confirming that this fibonacci level is ready to move the next one of $48-$50 per ounce. When will it hit this area? Well it could be this week, but I wouldn't count on it.


EBAY PRICES ARE MUCH HIGHER


Michael Jonah did an amazing presentation today showing how the prices of silver are going for a lot higher on EBAY. 1oz Johnson Matthey Bars are selling for over $40 per ounce and well over this price. The 100oz bars were selling for a small hair over spot price, but it's been wild seeing these 1oz prices for the levels they are traded for on the real market. I searched Canadian Maples and they are selling for $35-$42 per ounce plus a high amount of shipping. I even seen one maple with the common milk stain on some of the coins have people bid on it and at higher prices. These are more signs that the disconnect is happening from the paper market and the real market. If we see a market retracement from the paper contracts to significant portions (going below $30)the disconnect will even grow further.

Friday, February 25, 2011

02.25.2011

Big up day today to close the week.

To enlarge on any image, simply click on it


Not much to say here other than have a great week and that the market impressed me with the sideways contraction. I'll try and follow on Saturday with more on this. At some point soon the bombshell silver announcement will kick of and it seems as if those big things that need to be done for silver to take off coming into play. The comex shortage and bank run if you will seems as if will cause a big market reaction. I don't think this will cause lower prices either. The video below is key fibonacci levels and a spreadsheet calculating them. If you want a copy send an email to endlessmountain2008 at yahoo.ca and I can get one out for the end of the weekend.


Thursday, February 24, 2011

04.24.2011

Monster Retracement. Market remains Bullish


This is the first ever side by side intra day chart for silver priced in both dollars and gold. Wow, they look the same and they both took a pounding. This does not kill the trend by any means and if you are by the books of "Past resistance becoming support" then a test of $31.40 is most welcomed. Moves like this are common in major bull markets when you get moves of this kind of magnitude. Thats why if support goes all the way to $22 then the explosion should be greater to the upside. I don't want to talk about $22 as of yet, but the current support level is $31.40 area and that would be massive. This big upside fibonacci target has not had a confirmation breakout it's easier to confirm these moves with any kind of correction in comparison to having big explosive gains.


The daily chart shows a decent size retracement. From the 26.30 lows the following are key linear fibonacci levels

38.2% = $31.26
61.8% = $29.37

This means the market remains bullish (but barely) on the intermediate term. Below $29.37 puts this market into a bearish and making the $8 rally a failure. Lets not jump the gun on that as it is "a what if" statement. What is now is the $31.26 matching up with the $31.40 area from the upside.


It has fallen through the five day moving average putting this market to a neutral setting. This is the first test of the ten day moving average since this rally begun over a span of almost one month. This is strong as it says that it has not corrected that much in price or through time (until now).


It might be extreme to put this chart in with Silver priced in AU/mg, however I have to prepare and/or find a way to chart silver for the post dollar days. Plus, people like the gold to silver ratio. Well, this is the ratio chart (reversed) as well as a silver to gold ratio chart. The trend for this is very similar compared to the dollar one.


Video below is one of the average gasoline prices priced in dollars and silver.


Wednesday, February 23, 2011

02.23.2011

SILVER HOLDS ABOVE $33


To enlarge any image, click on them


Today we seen the dow jones fall another 100 points which puts it down between two and three percent for the week and the Nasdaq is down around four percent. Gold is up over one percent, Silver is up almost four percent, Platinum is down over three percent, Copper down over three also and Palladium is down over nine percent. It's interesting to see Silver and Gold hanging on as the rest of the markets go to the down side. In today's action it traded mainly sideways, but it was an up day. In the video I was talking about the importance of the $33.59 level. The first test of this managed to break above and hold above it for over an hour. Then the second time it came to this level it was met with resistance. What I like about this chart is that after it was resistance around 1pm it didn't make new lows and it seems poised to take this level. The reason this handle is so important is because of the Fibonacci from the selling that started from the highs of $34.33 down almost two dollars. For this selling to be a failure it needs to confirm a break above this $33.59 mark. This seems as if it is going to do so very soon and if this is the case then a test to $34.33 should follow us to new highs.


This 15m Line chart is very bullish now as it is well above all of the key moving averages. There has been some corrections in this market after we had some massive gains and because of these corrections, it seems poised to have another move higher. I am getting many comments on a market top and there is absolutely no sign of a top in this market for the intermediate trend even. The technicals and fundamentals are aligning themselves up with big reasons to see higher gains. The fundamentals are such things like the basics to how money is created and suppressed lower, the physical inventory of readily available investment silver as well as its demand in industrial uses. The techs have shown this market to have major moves recently and corrections (price or time) every now and again. We just had one of those now and again corrections through price going from 34.33 to 32.40. This doesn't mean that the correction is over, but I would think its probable that the market makes new highs soon or at least corrects a little bit through time maybe.


What I like about this daily candle chart, is that it shows how the market is consolidating through time on the long term time frame. Intermediate term it corrected through price by going down $2.00 almost. That level is not that much on the daily chart. Correction through time shows indecision and normally these things result through the path of least resistance. This of course is not only higher, but MUCH HIGHER


This is another way of looking at silver. For all the other charts I have shown have been pretty much the Silver to Fiat US Dollars ratio. This is the Silver to Gold ratio and has been weighted in mg (milligrams). There are 1,000 mg in a gram and 31.1 grams in a troy ounce. There will come a time when these silver charts will have to be changed as a currency that dies means we have to let it RIP (Rest in peace). Letting it rest in peace means not talking about dollars much any more and throwing away these charts. It's not dead yet as the kimo is still holding in there.


WHY RISING SILVER & GOLD PRICES IS A GREAT THING!


The video embedded states that the rising gold and silver prices are a bad thing. All key information from the three minute video will be in this video, Because I disagree very heavily on the information in this video I decided to put up this little mini article. In the video the author first states that he has acknowledged many people in the youtube and precious metals community cheering so much that these prices are increasing with “Hooray” kind of reactions. The author states “It is completely wrong” and if gold goes up $30 and Silver $2 that we should “CRY!” without any reason to be happy about it. He then states that it is weakness in the dollar and that the price is not moving at all for any other reason. The next point he makes is that the country is in duress and that by cheering for higher gold and silver prices, then this is pretty much what you are cheering for. The final point from the author is that demand is not there for the commodities and the reason there is demand for gold and silver is because there is a few people awake whom has found out that fiat money is worthless.

My reply to this will start with the authors comments in that we should “Cry” when we see these rising prices and why I see the opposite. With the increase of gold and silver prices, this means that each individual human whom has made moves to get into this metal are seeing gains in their purchasing power, this will give them an advantage during these messed up economic times. This is one currently setup for “Survival of the Fittest” and in my opinion its not a reason to “CRY” when you are making positive steps so that you and your loved ones can survive in this brutal economy. The author stated that it's “Completely Wrong” to be happy with the prices going higher, and I think that it is “Completely Wrong” to enjoy fiat money and a debt system that ensures the suffering of a vast amount of humans. Should we celebrate if JP Morgan is able to short the living hell out of the fixings and bring the price back below $20.00? After all according to this author if its wrong to have reactions of $2 up days, I guess it is “RIGHT” to have happy reactions on $2.00 down days by using the simple law of polarity (opposites).

Finally the author states that it is only the dollar that is making the prices go higher. What we can't do is look at the US dollar index to see if this is true. Because if the USDX goes up a small amount and so does Silver all this tells us is that the US currency was stronger than the other weak currencies. After all, every currency is weak. What we also can't do is look at gold and silver going up in every currency and state “Yes, gold and silver are going up only because of the dollar.” Rather, look at the price of gold and silver in other real assets. If the price of other real assets are cheaper to buy in gold and silver, then its more than just the dollar losing for the price increase and also the asset class gaining value. I will not speak for gold here, but speaking for silver the people whom have purchased silver below the summer 2010 breakout when the price lower than $20 are now at the point where they can gain against many other real assets. Average gas prices on June 14, 2010 were $2.70 and today it is $3.17. If you sold 1 oz of silver for $18.00 in June you could get six and two thirds gallon of gas and today selling for $33 you could get almost ten and a half gallons of gasoline. This is showing not only dollar weakness driving silver up, but also silver gaining in value

Final Comment on why I cheer for Rising prices

The author was correct when he stated that the prices going higher brings duress. It is also correct that the rising prices will be very bad for the economy. However, I personally am cheering for an economic collapse because I don't like the current economy. If you have a house that is 125 years old and has been renovated four or five times you may start to notice there is nothing you can do to keep it a float. What the best idea might be is to tear the house down completely and build a new one with all the fancy current gadgets available today to make it the best house you can imagine. I see the same thing with our economy. The currency has been renovated so many times when you go back to the 1930s when they pretty much went off the gold standard as a renovation. Then in the 1960s and early 1970s is went off the Bretton Woods System which was officially going off the gold standard as well as taking silver out of our dimes and quarters. These were dollar renovations. However the house (cash) is a mess and I would personally like to see this currency/economic standard of living get destroyed so that we can build a new economic standard that can work with today’s gadgets that we have that is the best economy that we can imagine for the people. I know for sure the system where the fed creates money out of thin air and uses interest at many levels is only making many people suffer and this I do not want to see anymore. Call me crazy if you wish, but I have good reason for wanting to see this fiat currency die and I know one of the steps needed for this to happen is an explosion in precious metals and all real assets. There was a wrestler whom performed at the end of 1990s and into the 2000s named “The Rock” aka Dwayne Johnson whom had one of many catch phrases called “JUST BRING IT!” and as far as inflation and economic collapse is concerned, I have to use the same phrase.

Tuesday, February 22, 2011

02.22.2011

MANIPULATION 101!


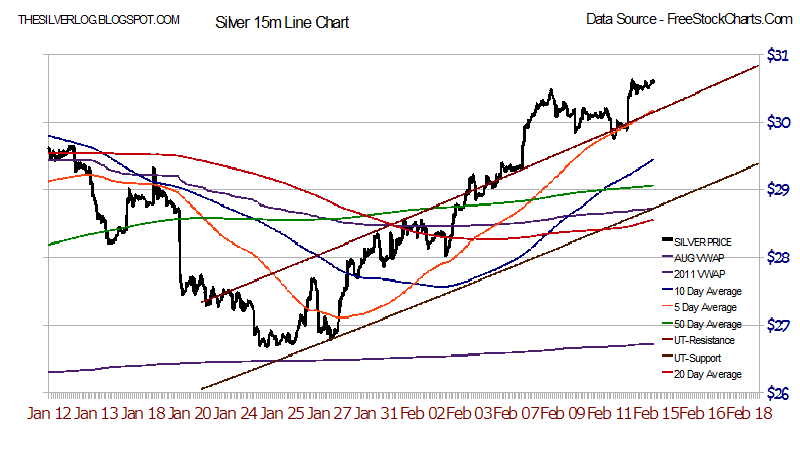
This chart above has been MANIPULATED! I am the Manipulator! I have exerted shrewd and devious tactics to my advantage! What I normally do to manipulate this 15minute line chart is import the 15m data from the SLV shares and I increase the variables by exactly 1.022837066 greater to match the comex fixings. That is not what the manipulation is here. What the manipulation was putting the value of $33.56 in after the 4pm Friday close and before todays 9:30am open. The value of 33.56 x the rate mentioned earlier equals $34.33 which translates to the top of the market almost one day ago. I am using this to my advantage, because this can help me with potential future trend line analysis as well as eyeballing fibonacci levels or anything that may be needed for having this level in place. I will talk more about manipulation at the bottom of this page.

However, as far as what this charts shows us is that the price movement lower has sent us back to the trend line. As long as this market stays in this trend channel, then it will remain very bullish. Often times when you have a big price increase and you do not like getting into the market when its up so much then one may want to wait for a significant pull back. Well here we are, as this was a retracement of around $2.00 from it's high. I often have people asking if they think there will be a pull back, and of course there will be and trying to guess tops and bottoms is a hard game to do. I never tried to on this one like I did at the end of 2010 with the $31 level

INTRA DAY CHART


Mainly a sideways day on the New York Time frame as the selling came in the morning. The silver lining here is that the broad indices got hammered today as the Dow Jones was down around 200 points and the Nasdaq was done 75 points. Platinum, Palladium and Copper all got hammered today, while Gold and Silver survived the thrashing pretty good. If you are wondering if this market was Manipulated today, it would probably be best to give you my opinion which is that: YES, but every day is manipulated. Often times on down days I hear many bullion bugs state that its manipulation that this is happening. They are right, but it was manipulation that seen the market go up from $26 to $34 as well. If the market sells off in a decent amount of time a decent amount of percentage points, then the physical market will not be happy and may not reduce their selling prices that much. After all, they know this is all manipulation. Well if thats the case, why even sell bullion 999 silver at $80? It's going much higher than this very soon.

Daily Chart


A decent size red candle, but this is after three big green candles in what was already a strong trend. The key support level on any big moves lower is $31.40. This was that big key resistance level way back when, and now it is support. Before I said that i wanted to wait to buy around $26 or a confirmation above $31.40. Well, i bought at $28 on the day after the bottom and I will inform you on this blog when I see confirmation of a break above this massive fibonacci level. It's easier for me to confirm this if we retrace back to or close to this area, but either this baby will get confirmed one way or another on technical analysis. As far as fundamental analysis, confirmation is so set for this to scream higher and technical analysis has already confirmed a move to the $48.36 area on the longest of term charts. Because of this, I refuse to get shaken out by any of this non sense selling.


MANIPULATION

It would be so cool to chart how the big banksters were and are manipulating not on this silver market, but so many different markets and aspects of culture. They manipulated the currency so that they would go well out of their way to keep us the people in form of how money is created and how debt is 100% guaranteed by using mathematical formulas. One of the many ways it seems that was done was the suppressing of the gold and silver market for quiet some time. How many of you people were excited and enthusiastic to buy silver back in 1990 or 1995 or 2000 or 2005 at these firesale levels? I was not one, because at that time frame I never even considered silver as a way to make investments. This was not stated on the television screens that I had watched at the time. Then there may have been some other peoples whom knew it was manipulated then and still didn't buy because they thought the manipulation to the down side was not over yet. Any way you put it manipulation is there and when you see the definition of what manipulation means you can find it to state exerting shrewd or devious influence especially for one's own advantage which is what the bankers do. It's to their advantage to keep us enslaved in this money debt system so that they can keep their ponzi game going as they try to be the kings of this planet. What shrewd or devious stuff they do is impossible for me to answer. I know some of the stuff that they do is short sell the price of silver to lower the prices down. They use fractional reserve banking and one way within' silver this is done is having a lower inventory of bullion than they offer for sale. You can comment on this page with a google account, and would love to hear what you have to say about silver manipulation. I have included a nice link from Bix Wier from Road to Roota which has some good information on it. Thank you for stopping today and keep stacking.

Monday, February 21, 2011

02.21.2011

Click on Image to Enlarge


Technical Analysis on a Comex Failure and Wild Times!


Technical Analysis on markets that surge out of control with wild moves usually increase its volatility and bigger moves. I can not count how many times I have seen the five day moving average be support, resistance or break through and above and because of that I generally know what to do pretty fast. I can't count how many times i've noticed an up or down move fail because it broke through 61.8% key level. However, I can count how many times a comex failure has affected the silver market. The answer is zero! We are in unprecedented times, and logic would state it could make massive moves and in the meantime the same technical analysis principles can come through. For example, the chart below is the daily chart and the resistance that has connected this one month rally is now broken to the upside. This is huge and usually results in more volatility and a market top (for a few hours/days). I would suggest otherwise that this is a market top because of the fundamental news. If this takes off, then just maybe we may test that trend line I was watching throughout the fall of 2010. Currently this baby is at $34.00 and it is unprecedented to have another 12% gain in a short period of time. But C'mon, this is not normal times.

The article I seen from a posting forum with links within' them shows this is going to be a march deal. The comex contracts are month ended (Feb 28) and there is not enough physical to match the actual holdings (surprise, surprise!) and its a matter of when and not if the comex fails and to what degree the price action will react to it. Well, the when might be soon and I'd guess price action will go wild (to the up side). I'll try and put another post before the end of the day. SLV is not trading today and thus I can't use their data today to make charts.


I am using the curve chart to analyse a parabolic move within' silver. Holding this trend line is extremely bullish for the market because the rate of ascent keeps increasing on a week by week basis. It's hard enough to hold a regular uptrend line, but holding this takes the cake if you will. This will be the final update for the day (pending a major PM movement in price/news and below is my intraday video. Thanks for stopping by to this page :)

Friday, February 18, 2011

02.18.2011

Video created today regarding a chart for JP Morgan. Also has more info on logarithmic vs linear charts as well as a simple example on physical supply and demand.


Silver makes another gain breaking $32.00 USD fiat dollars

To enlarge an image, click on the photo


Productive day today on the market. The market managed to make it to $32.87 today before selling off. I can't show you everything on this chart as it only has times from 9:30am EST to 4:00pm EST. However at around 8:20am EST the market bottomed at $31.64 and the top was $32.87 as mentioned and shown on the chart. The difference of these two numbers is $1.23, and with this information we can calculate Fibonacci Retracement. 1.23 x 0.618 + the low of 31.64 gives us a figure of $32.40. That happens to be the level that Silver ended the day with sideways consolidation. It bounced above and below this line and this is fibonacci doing what it has done so many times in market action and thus by holding this support, it gives me reason to be optimistic going into the weekend


Two consecutive days silver has made nice gains after the sideways consolidation. As I was stating before that the more often a significant level of support/resistance is tested, then the better chances it has of taking the level out. The level here was $31.40 and sure enough it took that level out very nicely. There is no confirmation on the daily/weekly chart as of yet on the breakout, however there is confirmation on the longterm chart (quarterly line chart, not shown today) for Silver going to $50.00 and there is confirmation when you use fundamental analysis for silver going not only to $50.00, but much higher than that. The only question is when it will happen.


The weekly chart above is very strong. The selling that occurred to start the year was a simple dip on this current bull market and we had three red candles lower and four green candles higher that has now taken down the previous highs of $31.28. It has now broken this level by around 5% and would like to see it come back down to this level where it could find support, but if the market wants to keep rallying higher, that is fine with me.


When I look at this upside fibonacci chart, I get very excited as everything seems so clear to me. This shows me sellers could not get very active at the $31.40 level. Yeah, they managed to bring it down to $26.30 which on the grand scheme of things is only a small move. Silver having 15 percent up or down moves is petty change really and small ball. The break above this line has given us a decent pierce above it. Remember it has only surpassed it by five percent, and thus it is small ball to the upside. However, my eyes see this as a failure for this level to be that strong of resistance and would expect the $48.30 level (really $50.00) to be tested somewhat soon. It has a chance to test it next week (although very highly unlikely), but within' the next 4-8 weeks I would think it should make it to this direction.


On this weekends video, I am going to draw better trend lines for the week and readjust them automatically for next week. Because it surpassed the upward trend this shows me how strong the bulls were this week and how relentless they managed to get the market higher. Of course, If I am to say "THE BULLS" as in the people, it might be best to define who these people are. It's not your every day investors whom put in 40K here or even 250K there in fiat debt notes to silver. That kind of money can hardly move the market at all. It is the big financial institutions whom control the direction of the market. I would like to be a fly in the wall in that key room of JP Morgan to where they make their big decisions, but I feel a lot of this is short covering aka short squeeze rally not only this week, but over the last half year or so. I wish I knew how much they have left to cover, but the trend is higher and I look forward to what will transpire next week

Thursday, February 17, 2011

02.17.2011

This video was awesome. We'll I enjoyed making it and its for the long term outlook on why $50.00 is next. However, I just thought of a gret way to have a second part on this video. I'll try to get one out tomorrow to show the greater levels above $50.

Silver breaks out!


All images can be enlarged by clicking on them and can be used in your videos/blogs if needed.


AFTERNOON VIDEO WHEN SILVER WAS $31.50


The market was resilient today. It kept going higher and higher and higher all day long and it was up another $1.00 today. These kind of moves makes Joe (aka silverfuturist) very excited and it will make me smile to see him so happy about the move. However, the $31.40 level that was big resistance was taken out today. What I would like to see silver do is correct through time for a few hours and find support at the previous resistance at $31.28. This was the high that started 2011 off with and then start moving a lot higher from there.

FIBONACCI UPSIDE
For those whom are not aware, fibonacci upside is a tool used to predict where charts have the potential to go towards. The calculation used for Silver takes the $4.00 bottom from a decade ago and the $8.00 double top you will see in the image below. The math formulas below give us the following targets:

(HIGH-LOW) X FIBONACCI + LOW
Level 1 (8-4) x 1.618 = $10.47
Level 2 (8-4) x 2.618 = $14.47
Level 3 (8-4) x 4.236 = $20.95
Level 4 (8-4) x 6.854 = $31.40
Level 5 (8-4) x 11.090 = $48.36


The psychology of hitting the $31.40 last January and only having a small retracement to $26.30 is very strong for Silver. If resistance is not met at these key levels or the resistance is very light, then the probability odds state a fast move to the next key resistance mark. This is the $48.36 level which is next on the horizon for Silver. Today is only the break of the level and is a small pierce above it by only a shade over 1% thus far, but when you mix in the fundamentals for silver within' the technicals there is reason to get excited about this rally as it seems poised to keep on breaking through to big gains.

Wednesday, February 16, 2011

02.16.2011

Market stays flat today, as Mondays gains keep consolidating

Todays Video


To enlarge the images, simply click on the photo


It was a volatile day today as the silver price kept fluctuating both to the up and down side. It has now stayed above $30.00 for a decent amount of time and overall the gains in the market seem to very reassuring that this market wants to proceed higher to the upside and take out the key $31.40 fibonacci resistance level. One of the images added today is the 15m line chart going back to July of 2010. This has a straight line trend line that is now at $38.10. It would take over a 20% gain to get to these levels and not only would I expect it to test this level in 2011, I expect it to explode over top of it. That says a lot as the trend line is expected to reach over $100.00 by years end. Youtube user AlexisCom1 has shown great interest in this trend line and I highly recommend his channel. Alexis is a Russian Canadian and has many great videos. One of the reasons I expect it to break this level this year is because when inflation gets out of control, it doesn't take long to really explode. This seems to be the year I expect it to happen. Maybe it is because of my research on the mayan calendar and how culture and society is going through this consciousness shift, but I also often think when I hear many people state "Silver is so cheap at $30", that what number can we keep saying Silver is cheap at. is $50 cheap? Is $100 cheap? Is $250 cheap? Is $1,000 cheap and is $10,000 cheap? We'll, I will not say $10,000 is cheap, but I firmly believe that $100 would be cheap in the event that within' the fundamentals of fiat currency as well as the price manipulation throughout the 80s and 90s to be also tied in with the physical supply versus demand that the value should be well north of $100. Thanks for viewing the blog today and I look forward to tomorrows action. Take care

Tuesday, February 15, 2011

02.15.2011

Silver continues it's gains from Monday with a time consolidation day


To enlarge an image, click on the image. These images can be used for your presentations if needed. Get a hold of me if you are looking for some specific image


I guess I should copy and paste everything from seven days ago or last Tuesday, because the theme is the same. Coming off a nice up day we seen the market consolidate it's gains through time. It was still an up day today (barely), but on the daily chart (chart above) it has encountered a single candle sideways move and this is very bullish for silver. Therefore, i'm going to make it short and sweet today and the video below (made at lunch time today) talks about the debt ceiling, gold to silver ratio and the market on the daily chart


The National Debt is getting very close to the debt ceiling, which is shown on the chart above. It kind of annoys me to watch mainstream media talk about issues like "Can we pay off this debt", "Can the debt get under control" when in reality debt is 100% guaranteed on simple math of how money is created. If $100 was all that was in existence in a small world and John wanted to borrow $20 from me, I could say "Sure John, at 10% interest, I will do so." After one year John pays me back $21 and now $101 is in existence without the creation of money. $1 of that money is debt that someone owes and the cycle would keep growing larger and larger. If you want to know more on how money is created, the three videos I recommend can be found with the following google searches:

MONEY AS DEBT
ZEITGEIST FEDERAL RESERVE
AMERICAN DREAM CARTOON

- Big Moves in a short time.

I recieved a comment a week ago that said from a user "We should see $45.00 US by the first week in March 2011." which had a reply back from a user today stating - "I think that's an overestimation. Remember silver doesn't go straight up, and can just as easily drop again after hitting some new ceiling. $35~38 would be more accurate in my opinion."

$45 from the level of one week ago would be a gain of $17.00 on $28.00. That is about 60% for a relatively short period of time. The comment given back was for us to REMEMBER that silver doesn't go straight up, and I am here to proove that it can.


Monday, February 14, 2011

02.14.2011

TO enlarge the images, click on them. You also may use these images in your presentations as long as the website link is on the photo. I try to make sure that the link to this page is on every image I put on here.


The uptrend for silver continues today as the market gained around two percentage points to a close of $30.61. This means the $31.40 fibonacci upside target level is now under three percentage points from our current level. It was resistance on the first hit back when the 2011 year started and the chances that it breaks through is higher than it was six weeks ago. Below is the video I made for todays intra day Silver Log


Final Comment - The truth movement has been a bore for me the last few weeks as I am more intrigued by the action movement where we will see progressive changes in this world. Sure, Egypt had a change as Mubarik stepped down, and I laughed when the people around the world thought this to be a real progressive change. I laugh because all this means to me is a new dictator whom is in charge of things. In fact, the military is now in charge there and thus this seems like Martial Law is now in place in Egypt. The changes I am more concerned with is that of the death of the fiat currency and the fallout from the end of fiat currencies. For three years I have been expecting the dollar to die and have been warning people. I am bored and tired of warning people about the dollar. If anyone wants to know any information to why it will collapse, I'll tell them and most likely refer them to three google searches which are "zeitgeist federal reserve", "money as debt" and "american dream cartoon", but I will not feel sorry for anyone whom is not prepared for what is about to go down. The information has been available to them on youtube since 2007 and it's not my fault if interest in "The Biggest Loser" or "CSI Miami" is more important to them. When we live in a world where Silver was $50/oz in 1980 and overvalued then to the point where it has progressed in being down almost 40% while the above ground supply is lower and the demand for usage grows higher during the current industrial age I often think "Hmm, what is it worth today?" and I refuse to answer in dollar terms, unless I am desperate for an answer. I guess that answer would be properly valued around $250 and overvalued at over $1,000/oz. After all in 1980 it was properly valued at around $14-$15/oz. Instead I would like to think that the amount of real assets you can get as the future goes higher is going to be an advantage for silver owners. If product A costs $320 or 10 troy oz of silver today, I can make a calculated prediction that as some time goes by that the cost maybe $400 or 7 troy oz and the rate to keep heading in this direction. The cost of goods to be more expensive in fiat debt notes and cheaper in troy ounces. Because of the suppression of silver, I believe this to be true as the market re balances it self in the upcoming weeks, months and years. When the stock market was below 7,000 DOW in 2009 I felt things were moving way to fast and I said on youtube (video below) that I wanted the market to go higher so that people would have more time. Well this has happened, and now I think people have had enough time. My hope is TSHTF Very soon!


Friday, February 11, 2011

02.11.2011


The week is over and the price of silver has remained at the $30 level. Have a great weekend everyone :)


Update 12:22pm EST - The silver market has moved down to the five day average and the top of this trend line. It's an area that has a decent shot of bottoming for the day. That only means there is a decent shot on this (aprx 70-75%), because it would be a failed move if it does not find support and thus a big move would head lower if support does not get met at this level.


Update 1:15pm EST - Its looking good to go that the market is bottoming with a nice pop up rally that has brought the market up to $29.91. Still a long ways to to go.