Today the market remained in a sideways pattern as it consolidated Friday's gains. 2% top to bottom from the highs and lows shows it was not that volatile and the volume today seen only 22 million shares trade on SLV which is lower than the 50 day average of 27 million. The five day moving average is now rising and the market is above the downtrend line. This means the trend has been broken. A break of a trend line can mean one of three things 1-Trend reversal and the market should go from a downtrend to an uptrend 2-Market to correct through time or the rate descent will not be as greater 3-Bull trap and thus a failed move, which should create a fast move lower
With all that being said, the 50 day, 20 day and 2011 Volume Weighted Average Price are all declining and above the current price of $28.00. This means the battle is between the rising five and day averages versus the ones mentioned.
The 50 day low will change to $26.34 tomorrow and thus there will be a dip in this chart. After this happens then it will remain near this level for a decent amount of time. Thus, the charts will re-adjust themselves and I'll show Tuesday what it means on the blog again. The main thing is that the downtrend line has been broke and the five day moving average is rising, which now puts the short term in a uptrend.
The monthly chart, which is one more suited for long term traders is still in a major uptrend. This was the first down month in Silver since July of last year. This has given us one little bit of a correction on here and at the trend is clearly higher. No reason at all to give the sellers any credit what so ever on the long term time frame because of the major rally from the summer breaking the $17-$18 levels. Mix this with the fundamentals of silver being priced in fiat dollars that has no intrinsic value as well as the fundamentals of people waking up to how currency is made and doing something about it. The sales of physical silver has never been so high and the demand is soaring. When these factors come into to play this gives us exceptionally strong reasons to keep on stacking.
Silver will start the first week of February in the high $20s area and a down month in January. There is many bullish indicators on the long term charts, which should come to no surprise with money printing going out of control
Click on the images to enlarge them
The fibonacci upside uses the $4.00 and $8.00 level. It is calculated by taking the difference of the two variables ($4.00) and multiplying upside levels (161.8%, 261.8%, 423.6%, 685% and so on) then adding the Low variable which also happens to be $4.00. The $31.40 level I mentioned was small resistance thus far and if we hold around the $24/$25 level and move back up, then watch out for a breakout to the next one around $48.00
Weekly chart shows the selling is a counter trend move to the primary trend which is bullish. It takes a lot to make this trend go bearish on the long term because of the chart below
This could do much lower before we break the uptrend. The bottom line is around $10.00. Although I don't expect much more than a 50% retracement as a max possible one which would not be over $15.00, it would be bullish to stay above this line. I feel we are soon entering super bullish. I would expect the chances lie towards making newer highers than retracing to previous lows. But remember, JP Morgan can do many different things to the fixings, but are not able to take away its intrinsic value.
On the 15m time frame the market managed to get up to the top of this trend line. The low from the 50 day looks like the first entry is around $28.33 for a breakout and if $28.33 were to come it would also be a break of this trend line which can at least move the market to neutral
The market is showing many failed moves over the last few days. It was looking like it wanted to breakout on Wed night or early Thu morning and that did not happen and we had another intra-day crash yesterday. This looked like we were heading to make new lows, and although we did by a small fraction the market is surging today as stocks plummet. The silver market is now at the top of the trend line. I will go over more this weekend on the trend line.
There will be no videos or extra commentary today (Friday) on the Blog. The contest winners will be announced on 01/29/2011 as well as more data regarding the silver market and the silver rally today.
The bear market continues for silver over the intermediate term time frame. This means lower buying opportunities (if you can find any) for the physical bullion. The market is inching closer and closer to the $25/$26 level that I expect to have a massive bounce from. This morning the market plunged, and I can only guess it was JP Morgan doing their old nasty tricks that they like to do. I find it insane how we are buying and selling our bullion silver based on what Chicago, London and world paper traders are saying it is worth. If the market crashes below $20.00 per ounce, there will be some major disconnects from the paper and silver market. Below this video, is an article/story that I wrote today with my experience at the silver dealer today.
The gold to silver ratio is in a bear market as Silver has been outperforming gold during the last year or so. Because we are in an intermediate term correction, the ratio is also correcting. When Gold and Silver goes up, generally silver will have days greater than gold. If Gold gains 1%, then Silver may gain 3%. However, on the way down if Gold goes down 1%, then Silver may lose 3%. Because of this when metals are in a bear market, I'd expect the ratio to go higher and when they are bullish the ratio should keep heading lower
ONE SILVER MAPLE January 27, 2011
I have been calling for the silver market to retrace to the $25 to $26 level as having a good chance of becoming true as it was approaching the $31.40 fibonacci resistance level. I have a good idea how the paper trading market works and feel that I could sell a few bullion coins at the top and then buy again as it dips below to that level between $25-$26. Now that the comex prices has managed to dip below the $27.00 handle I am getting very edgy as I now want to get my hands on some more silver. After all, the last thing that I want to have happen is for the market to bottom at $26.50 and not be able to buy on this dip. I started buying again last week and was only able to get generic 999 rounds for $32 CAD per ounce when the market was at $28.00/oz (The Canadian dollar and USA dollar pretty much the same value). This morning I seen once again that the market had another intra day crash as I seen nothing but big red candles on the 5 minute finviz chart as the market fell from $27.75 down to $26.80. I thought this was a good enough correction to head down to my local coin store and see what I could barter. When I arrived at the shop I seen a total of zero bullion grade coins in the shelves. The only bullion coins are the ones that had hefty premiums because they were rare years (the 1997 Canadian series) or had something fancy with them and those prices were $45 and higher. There was some decent prices on scrap 80% and 50% Canadian silver, but I am not as interested in this right now. I decided to pass on what he had in his display and then I asked him “Do you have any 999 rounds or bars you can offer for $30?” He told me that he found a maple at his house when he was cleaning some stuff around and he could only sell it for $34.00. It was all he had and he knew it was not going to last long and because of this he could not go any cheaper I knew that was the going rate, and although I didn't want to spend that amount of fiat money for a coin, I decided to not leave the shop empty handed and handed him two green Canadian twenty dollar bills and in return got a Maple leaf silver one ounce coin as well as a blue five dollar fiat note and a USA $1 fiat note. Therefore I traded two pieces of paper for two different pieces of paper and a coin weighing a shade over 31 grams. There isn't much left and I feel as if I have to take a trip soon to Can-Am precious metals which is almost an hour drive to get silver. They still have a decent inventory, and their prices this afternoon when silver was $26.75/oz CAD was $34.11. This means they are charging over $7.00 over spot and that might be the best I can do. I can try to make a few calls and I also posted a KiJiJi ad offering to buy Maples/Eagles for $30 and generics for $28. The ad was free and it will be a bonus if I can get them at those levels.
.It seems that the silver shortage is real and if the market manages to have more major downside, then we will see a major disconnect in the physical and paper markets. There is no reason for the market to be retracing this much fundamentally and because of this I feel as if this bull market in silver is going to have to keep going as it should or we will end up having a major problem if silver goes anywhere south of $24.00/oz.
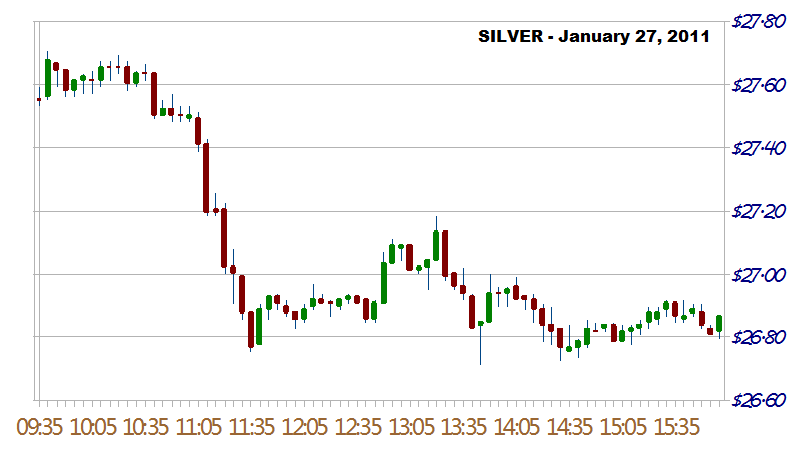
I was expecting the silver market to head lower and it did not. We have a nice rally at the end of the day that seen the market go from its low of a shade over $26.60 and gain almost one full fiat dollar. With this image above you can see how it corrected through time/price for about a hour or two and then built it's energy for another leg higher. The fed did speak today and I had no idea that they were going to. To me its all irrelevant because the fed, fiat money is all a ponzi scheme. The market managed to get above the five day moving average. Even though the chart shows that there was no resistance at this average, there actually was. From 3:02 to 3:09pm EST it was resistance and then it blew above that level. So it was resistance for a very short period of time. With a declining five day average all rallies are guilty until proven innocent, and it is starting to be proven innocent. Now that it is above the five day average, then we maybe able to see this level start to flatten out and maybe proceed higher. The market is still trading in the downtrend range and until we break the upper band level the intermediate level is still bearish. As of 4:20pm EST we are barely up for the week now. We have not had four consecutive down weeks since February of 2010 and a lower low is a guarantee for this week and the previous high on silver in last weeks data was $29.08. It is still well below this level and its alright if we end this week with a higher high from last week. However, if we can build from todays rally, then it can make progress going into the next week it will be a positive sign. Regardless, it is building a nice four candle consolidation to the rally that begun last summer
COMMENT from YT user FLUZWU - What are the use of your analysises and the goal of these videos? Do you like to support people who try to earn money by buying and selling silver positions? It is not sure if you will like to do it but when you include opinions of other people and experts the value of your reports can get higher. Your opinion will be based on more sources. And do you reflect about your own videos? Like tell us if you had a clear view watching back to your stories of some months. Like before the ralleys started.
Answer: The use of the analysis is different for each person. For myself it is improving the analysis of charts for my continuous learning. I am an advocate that this world is changing from a negative world to a positive world, but I don't see technical analysis dying. Yes, I expect the money system to die and I hope and expect that we would use charts in different ways to use for analyzing the usage and production of resources, rather than the price of a market. For other people's uses, the main goal is for one to understand better how charts work and to help make my ideas their own.
You asked if I like to support people who try and earn fiat money for buying and selling. The answer is neither do I support or dis support it. Whatever it is people choose to do with this information is up to them, and I have provided a service I feel I can do very well. If one is able to profit from the game and now is able to put food on their plates or pay off debt because of this information, then I guess that would be a pretty cool thing. I do know that the game of buying and selling stocks is a ponzi scheme and is not productive for almost all users. Many people will lose in this gambling game, which is unhealthy and then you have the rich getting richer and that is also unhealthy.
As far as the comments on the "So called Experts", I first use the word "So called" as many people whom are proclaimed to be experts are not and many people whom are humble may actually be an expert. I have linked and referenced to many different sources and over the last two days it has been that of Peter Joseph, whom is the producer of Zeitgeist. This guy might be the best expert that I know of, however I make his ideas my own, as I expect other people to make my ideas their own. I notice the human race likes to talk big on celebrities and stars and this is a little pet peeve of mine. Oh Max Keiser said this, or Alex Jones said that or Warren Buffet is doing this and Peter Schiff believes this. I think "Big deal" and at one point there was a part of me that got a little frustrated that people would not mention my name when I called something so perfect (which I have on many occasions), but I am kind of glad it is this way, because I like being under the radar. People seem to be so strung up on celebrities and I don't see any one person better or worse than another. I don't want to get too popular at this moment and do not care a less if people mention my name. You don't hear any other sources stating how I nailed the $25 bottom call in November or how I posted on this blog on the day the rally started to take the rally seriously. There is a part of me that is glad that they do not. However, those whom have followed me throughout the months and years should have a good idea for what I'm talking about.
The final part of your question was asking if I reflect back on what I said before the past, before the rally started. If you look back at my older silver videos while the silver market was ranging from $16 to $19 per oz I was saying that Silver in the end game is going to win because its 100% the dollar collapses or at least transitions (gets fixed, however its unlikely to be a transition). This analogy remains the same, because of how money is created and how the current trends are aligned. The same analogy has not been changed. In the Zeitgeist movie towards the end, they were stating when you have a Scientific approach then you leave yourself open to new data that makes changes. Thats my philosophy and thus adjusting to the message of the market I feel is critical. I don't just mean what the charts say for your particular index or stock, but even what is going on each second in any aspect possible. The fed does this, and the net result is that, and thus the message is changed to whatever. Therefore, whether I am right or wrong in the past, that means nothing to me, and that's why I could care a less about getting popular because of my calls. I stated that in the summer, the longer a chart is consolidation through time, the larger the breakout/breakdown usually tends to be. I probably said this is in about 4 or 5 different videos then, and I was right on that with this case as the breakout was large. I know this because I have studied this from looking at past charts as well as adding the psychology that many people are observing the range and when the market continues to range it gets more peoples attention as well as the range being easier to see. It also makes the breakout/down more relevant during longer ranges, because as people add long/short positions, this gets more people involved in the range and thus when they are on the wrong side of this, then you get a larger cascade of people selling long positions on the way down, or in this case covering shorts on the way up.
Finally, the reason I make these charts is to show a long term perspective to buying bullion silver. Its a major pet peeve of mine that they state fundamental news for reasons that the market goes up or down. Its all hogwash for those reasons and math will always win. The approach I have used in long term trading using Fibonacci is very successful. There will come a time when the bull market cycle will come to an end and it will be time to unload on the silver. I expect the charts will tell me when this will come.
The downtrend continues in silver. No video today and there should be one on Wednesday afternoon. Currently the silver market as im typing this at roughly 7:55pm EST is breaking past $27.00/oz. The market is still in an intermediate term down trend and the sellers are in control over the short run. On the long run its still very bullish and I will be pointing this out Wednesday. I watched the zeitgeist moving forward today and in that video they talked about resources and using sane methods of tracking them and using them in a sane way. Obviously it seems no one knows how much silver is on this planet, and this goes to show me that they are not tracking silver that well. I would also think that they are not using it to the very best of measures. Because we are enslaved into the monetary system of fiat dollars, this means we have more shortages because its not affordable to mine the metal at these suppressed prices. Because of this, I hope you are not too worried about any paper contract lower prices that may even bring silver lower than my target of the $25/$26 range. If you are betting paper silver on leverage and the price gets hammered lower and your bank gives you a margin phone call then you have whats coming. If you buy physical bullion, then you should have whats coming also and that is a protection of wealth as well as what (as well as Mike Maloney) predicts as a great transfer of wealth.
WATCH ZEITGEIST - MOVING FORWARD BELOW (if you wish)
The market remains to be bearish on the short/intermediate term time frame and still holding on to a bullish trend for long term traders. If you are asking for lower prices because you want to buy more silver or buy for less fiat cash then you are getting your wish. The $31.40 fibonacci level has been perfect resistance thus far. $25.18 is the Linear 38.2% level and $26.11 is the exponential 38.2% level. This is often a spot where buyers can come into the market to drive up prices. Overall its a ponzi scheme how the market trades up and down, but does your dealer know this? Apmex doesn't care because they participate in this ponzi scheme by hedging their bets. They short the silver market when they buy physical and when you buy from them, they cover the amount that you buy. Thus they make commission. If you are looking to barter with people, it is sure a heck of a lot easier to do so when the market is lower, compared to when it is higher. Don't tell your dealer that the market is a ponzi scheme. Actually you can, because he/she either already knows it is, will think your crazy or will not understand.
Silver ended the Friday session in the area of $27.50 as the sellers continue to keep this market lower. This is the first significant retracement during this silver rally and as long as we stay above $25/$26 then we will remain bullish. Because it is below $28.00 it is no longer super bullish as it has retraced more than 23.6% of this rally. Intermediate term this market is in a down trend with a declining 5, 10 an 20 day moving average and below a flat 50 day average. This market will not keep going lower and at some point the buyers will pump this market back higher. Of course "MY GUESS" for that "some point" is around the 25/26 level. It's an educated guess because this is the fibonacci retracement of 38.2%. The indicator on the daily chart "Direction from the 50 day low" is in a downtrend and I will be keeping my eyes on this one to see when it will be giving signals to get back in the market. I used this indicator back in August and it stated that a breakout above $18.60 to go long and wow that was a great buying opportunity. What you need to see on that indicator is for that trend to reverse. You want to establish a higher low and a higher high and then you are ready to go. More on that as we move forward later on in the next few days and weeks
RUMORS OF HIGHER INTEREST RATES SEND COMMODITIES LOWER!
That is what I heard on CNBC today. This shows how much of a paper ponzi scheme this is and why silver and gold is such a great investment. I think can make it to the $26.00 level but if you want to start buying again on the dips, then here we go. Higher interest rates will just keep on ensuring that debt gets filled to high degrees. Any interest rates ensure debt and there is nothing you can do on paper to reduce the value of the silver market. I still kinda hope they can bring this down to $20 before we have the price explosion because I wouldn't mind getting more at these firesale prices. However, all that aside, this gives us reason to state that this $31.40 was successful fibonacci resistance as it got to $31.28 earlier this year and the current head and shoulders is a break. The VWAP (volume average price) in the photo from August is rising and is shortly over $26/oz. I would expect that to be support. However, it is in your best interest to remember that it is the big world banks that are the market makers.
Update - 11:49am The fibonacci from the lows and high has us right at the 38.2% mark. This level should give us some sort of bounce. If this does not then we are heading down to $28.60. We are living in a world where we have the Asians bringing the market up in the early session and then JP Morgan here in America will take us down. More on this channel later on
Update 2:02pm - It seems that the first fib level is not going to hold and thus we may head down to $28.60. Does not mean it will, but seems only "likely". In the meantime, I changed up todays video by using an imaginationland kinda style for eight months from now. Enjoy
Update 5:47pm - The market found resistance at the yearly VWAP and we are seeing a sandwich pattern with the resistance being the 5 day, 10 day, 20 day and VWAP with the 50 day being the only support level. It is four against one which could give the benefit of the doubt to the sellers. However, the market is in an uptrend in the long term point of view and the 100 day moving average is coming into play very soon as well as the VWAP from the August breakout if there is more selling. As long $28.60 can hold then the rally that occurred on Monday night will not be a failed move. We found support at that level today by reaching $28.62, but that does not mean it will hold that level. If a breakout or breakdown on the chart gives back 61.8% then that is a proper correction through price. Therefore there is no need to go to red alert on the silver market until it breaks below this level.
A textbook head and shoulders pattern was made on the silver market and yet it can not fall below the major $28 level which is a 23.6% fibonacci retracement from the August breakout and the recent highs. When i first got into technical analysis the head and shoulders was the first pattern that I was taught and I was told it is accurate at a high rate, but not 100%. It might be 80%, but its not 100%. It seems now as Silver is flirting with $29.00 that this pattern will not work. If this $28 holds then the sang "From failed moves can create fast moves in the other direction" can come into play. The failed move is that the head and shoulders pattern was not able to break below $28 and thus the fast move would be a move to at least the recent highs of the market which are currently at $31.28. I will have more later on the day, including charts and most likely a video. Thanks you
On the very short term time frame here is a head and shoulders pattern. If this baby fails and the $28.70ish area holds, then we are in for a wild ride. If it fails, then we are back down to a probable test of the $28.00 level
The video does not have analysis on the images above. We have found some support at the 50 day moving average as of now. If you bought at this level, then so far you have bought at "THE BOTTOM" for the year. Doesn't mean it will hold as a breakdown on this head and shoulders pattern gives us price objections to the $25 to $26 levels. Still below a declining five, ten and twenty day moving averages. Because the 50, 100, 200 day moving averages are rising and it is above those levels, I would expect that the shorter term averages to flatten and move higher in the next little while. This could mean that we have further downside and a test to the 100 day. The 100 day average is a shade above $25.00/oz and the 200 day is even well below that level. I will bring those averages in if the $28.00 level gets taken down. If it doesn't then there will not be any need for it as the trend will continue higher.
The market had some difficulty today as it continues to range within' a $28-$30 level. Do not throw out the idea that this might be a range from $25-$30 as a fifty day average break is the next direction for downside movement. That is to $25 and $26 area which would keep us bullish. When we are above the 76.4% level (as we barely are now) that means we are very bullish. When we are below the 76.4% and above the 61.8% then we are somewhat bullish. Thats why $25 - $26 is not only have a good chance of holding, but is also necessary to keep this bull market alive. If it dips below $25 then the market heads to neutral and the silverbugs around the world will be sayin' "Damn You JP Morgan!" or "Thank You JP Morgan!" The Thank you will come to those whom still have fiat dollars left over to buy more bullion because they know whether the price goes up or down means crap! The 4 up day sending Silver from $37 to $41 later this year will mean just as much as a move from $28 to $24. This is because the price is being determined by world wide traders, which the biggest financial institutional firms have the mass control. This would be alright if the Comex actually had all the silver and delivered all that was available. However, those whom have researched have probably come to the conclusion that Silver is a big time fractional reserve market.
FROM FinViz. Chart link is on the right side banner. Resistance on many occasions earlier has now beens support twice thus far with the trend line holding.
SILVER has been consolidating this level around the $28-$30 range very well as it is correcting this market through time. The chart above of the price memory shows us that we have spent more time around the $29 level than any other number during this bull market that started back at the end of August. Just like there is no such thing as "UP TOO MUCH" or "DOWN TOO MUCH" there is also no such thing as "CONSOLIDATING TOO LONG". Of course it will not stay in this range forever, but generally speaking the longer you stay in a sideways bound market then the longer the breakout/down will usually be in intensity/velocity. A big example of this was the long range it had for almost a year within' the $16 and $19 level and it corrected through time for a long time and then it had a big breakout.
Currently I am working on a new project that I hope to have completed this month and because of this I will be keeping the updates as basic as I can, but will try to get something out on the blog every business trading day. Thanks for your support
Silver down below $29.00 earlier today and it closed around The 29.33 area which was the top in November and the bottom yesterday. This has made the twenty day moving average start to decline. This tells me one of two things to look for. The first is a move from this area to roll over to the 50 day average and maybe towards the 200. Or this break below the 20 day average and the 29 area to be that of a bear trap. Often times bear traps are followed with a fast move in the other direction. That would be higher towards the $32 level. I have the price memory on the blog today and it's showing how big this level is currently at right now. It's the been the biggest of all of them during this bull market. Thats why the odds we have some sort of bounce from here would be pretty decent. This is both bullish and bearish to have a bounce to the $30.00. However it would be bearish if it would roll over from $30.00. It would be bullish if it breaks through $30 or consolidates the gains for further upside movement.
Fibonacci Retracement LOW (Today) $28.58 HIGH (Yesterday) $31.28 38.2% on the way up = $29.61 61.8% on the way up = $30.25 This means that the gain to $29.40 as of this posting could very easily have another leg higher of 20 cents to this point. If it does not make it $29.60 and starts to roll over then this could be a weak sign which could make the market have another wave lower.
December LOWS $28.00 Current HIGH $31.28 38.2% on the way down = $30.03. This level was voilated yesterday. 61.8% on the way down = $29.25. We went through this level for over two hours. It has regained this mark barely as of now. Therefore a failed move is guaranteed. The failed move is either the break below earlier on the down side or the entire December rally will be a failed move that would indicated reason for the $25-$26 test.
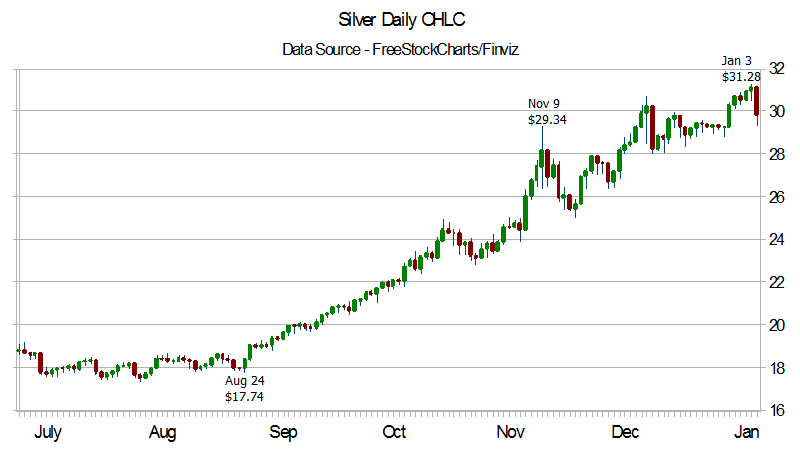
Breakout Lows $17.74 (Aug24) Current Highs $31.28 38.2% is $26.11 on a Linear level and $25.17 on an exponential level. If anything nature and math bugs are the ones that concerns with the exponential level and day traders and non math bugs would use linear because it is easier. The Linear 38.2% worked better on this last time. When Silver topped $29.33 and retraced lower the linear level was $24.90 and it found support on this mark rather than the one lower. Therefore holding above $26.00 keeps us bullish and with the 23.6% mark in the area of $27.50 we remain super bullish here. The Linear 23.6% is $28.08 and the exponential level is $27.35. What this tells me, is if there is another leg lower then the price target is at $28.00 as this level also meets up with December support.
Note - I did not expect to rant this much. If you get bored or your good at skimming then enjoy. There is a lot of good info in this article. Sorry for grammar and spacing. What you are getting is a rough draft on a project one would do in school. That is write an essay. This turns out to be a rough draft essay. I'll leave it like this for now and edit it in the morning.
Buying Dips!
When looking at this chart on the daily time frame the only time it has been correct to buy on the breakout was the original one at $18.00-$20.00 levels up to the $23.00 range. This is because the market slowly rose to $25 and then pulled back to $23.00. This meant buying at $23 and probably closer to $24.00 was already 4% move lower. This next rally brought us to $29.33 (Oh My!). The market corrected back to $25.00. This meant at least 2-2 buying opportunities starting at $28.20 and lower. $25 was the easiest and sweetest bottom call since the day I said to take this rally seriously on THE DAY it broke out back on August 24 (nod my head). Ok, I'm going to stop talking like Jim Cramer because I get many predictions wrong along the way. Instead, I will reply with Fibonacci did what it was expected to do and then some. The fundamentals support having some "and then some" days along the way. One of the predictions I got wrong was how short it was going to take us to $25.00 as I would have guessed a couple of weeks longer. Either way, it did what I wanted with $25.00 The next move is over $30.00 going back to $28.00 Maybe now that we have seen over $31.00 and we see this 5% move we buy on the first dip which just occurred. If it goes lower, you keep buying. The down side to that is a major bear market. The paper market has done this in the past.
However because the gain was only about 3% higher from December this means that this is an intermediate term top, which should bring us down to $26.00 as the first test. I'll come back later with that number. However, if todays levels can hold then this might be a breakout signal that should test the $36.50 number. This is the next level. If you can buy and sell at close to the same prices then selling at these key resistance marks has been profitable within' buying on the dips. This strategy seems so awesome and it does not work with parabolic moves. This is what it was like in September in full throttle turtle speed. It got up to $25.00 in no time or many weeks.
If silver had triple its volatility with the same movements to end this summer, we would have seen $40.00. It would be more common on 150%+ gain intermediate term rallies that massive swings using shorter time frame in or around a dozen days or big 12% kind of days and 7% moves in an hour and even one percent moves in a matter of seconds. This would be both up and down moves to those percentages. This could mean silver moving from $34 to $39 in ninety minutes. Then at $38.00 it loses 38 cents in 38 seconds. It happens sometimes. Maybe it does it 3.8 seconds. Who knows, the market can move very fast. In 2008 the Dow Jones was having 200 point moves over a cup of coffee. The Dow is also a collection of thirty stocks that reduce its volatility. The volatility of Silver is larger and we live in a world where at any moment its possible that on the clear view that massive 40% move is coming or whatever great lengths. In Math we were asked questions like 60% of 48. People said you can't use this in the real world and I know that answer to be 28.8. Having a day where silver goes up 40% in 5 weeks or 5 days or 5 hours would bring the market to $77. If this April morning has Silver going from $48 to $77 in one day or over a week then the mainstream will have to cover it. People are going to want to know why its going higher and then they will be told.
This video came out (below) and it should be animated short of the year. This video is expected to get embedded often and having more views on facebook, twitter or whatever means out there will help wake the people. Maybe this is the movie to show the kids? If they get scared, show then your gold/silver. Thanks for reading, watching and supporting the site.
)Earlier Rant) The videos above contain todays silver analysis as the top one. I'll talk more in just a sentences as it was a great day. The second video talks about strategies for either waiting for a nice dip or a confirmation for a big move higher as well as how I look at some basic selling strategies. The third video was made about a month ago talking about the significance of this $31.40 level of the 685% mark. The last video was the cartoon that was written well with a name that can help attract hits which works so good because the whole system is a dream that we can prosper as well as it has the potential to be #1 on google. Right now it is not on page one. The earlier rant did end when I talked about the last video. Therefore back to the Eaelier Rant
Now on to todays action. It was wild and fierce. It retraced more than most other days as the trend seems to be bottom between 10am and noon. It was a little longer and a little more fierce. $30.00 was not only psychological, but was also the 38.2% retracement. It did not hold and it was off to the basement in price action. On the long term analysis this move means absolutely nothing other than that small dip where one may add to the collection. Either way the reason why the market moves either up or down is because of the market makers whom have the excess paper fiat notes to make these bets. One may say that those individuals want to suppress the price lower. This depends on if they are "Ready, willing and able." Ready is part of the "action" of actually doing what is necessary. Willing and able is another one. If they want to suppress the price lower are they willing enough to do so? If they are willing enough are they able to do so? Just because they want to crash this, are they even able to get this under $20 again? I don't know if they are able to or not. I know with every action having a reaction that if they bring it down to $15 or even much cheaper below $11 that the reaction would be massive buying and revolution against the powers that done this. Thats why if you are holding on a physical level and the price goes this lower then you will see such a thing happen. Maybe they are not willing to suppress it this much lower because they know what will happen? I don't know, I am only guessing to this degree, but the important part is knowing that the only way they can do this is if they are ready, willing and able. After all would you sell a regular 1 oz maple leaf silver coin for $300? I would think everyone would because they can go out and get a handful more. Therefore would you be ready, willing and able to do so? Well I would know your ready and you might be willing to do so, but being able to do this right now is not really possible and thus you are not able to do so.
It's very hard or rare to say that a stock or index of some manner is poised to gain over 200% in one year. I guess thats what I am doing here is looking for the gains to reach us to $100 or over 200% from the $31.00 level we ended 2010 at. The indicators are pointing to this because of the fundamentals of printing all of this extra fiat currency with amazing ease. Throw in the fact that humans are waking up to this at high levels the likely hood seems very bullish. As commented in part one of this video that the Yearly chart is giving us a break above the three consolidation which was confirmed this past quarter (Oct-Dec 2010). If we make it to $100 it would be even smaller than the 1979 rally as it gained around 700% from its lows. The breakout on this rally occurred in August at the $18.00 level. Therefore its current gain has only been around 70% and therefore, you now know why I laugh when I people say "Its up too much it has to pull back" or "It's too late for me to get into silver."
Below are videos from Daniel at (VictoryIndependence and VisionVictory)
PETER SCHIFF ON CNBC
At the end of 2010 I happened to come across this video (attached above) which was from CNBC on Dec 31 Fast Money. Peter Schiff was on this episode and I could have sworn I was watching a Saturday Night Live skit. SNL did many political newscasts on their show and they were written with the hosts being so idiotic and making the smart guests on the show look bad. In this case you have the hosts say "Exceptionally low for an extended period, where ya been" and there is the example of making me laugh because low interest rates don't help the economy or currency. Interest by its nature of how its created is bad for the economy for the result in. Over 2 minutes in the commentator says very passionately about the dollar going up and how this is a good thing. I don't know if I should laugh or cry at this, because this commentator ignores gold and silver going up as well as how real products going up year over year. Instead it was him talking about the Euro and other currencies being worse than USA. Ok, well maybe so or maybe not! I personally do not care, because they are both fiat. All currencies in the dollar index and world wide are printed through debt measures that in reality enslave many humans in a game only the bare minimum can come out ahead in.
Therefore, it seemed like an SNL episode. The video below is a comparison to what I see. This is a video where the host looked like an idiot to the guest including the host yelling and screaming like the guy did with the dixie. I am surprised this channel is still on youtube and that SNL has not shut them down. Not sure how long this will remain