Pages


Thursday, June 30, 2011

06.30.2011


Two losing months in a row! So be it, that happens and the red candles for May and June are not that large on this logarithmic chart and more standard pullbacks. The market is still rising above the front weighted eighteen period average of highs, lows and closes. The key level to start this month of is $32.85 as this is the level for the eighteen period average of highs. Because the market is above the line and has not been touched since last summers breakout the market is bullish and no need (yet) to be cautious. More that it could become cautious if the selling brings us below the level stated below thirty-three and if you are looking for buy signals within' the current uptrend then you would need to see the weekly chart straighten out first or let the market move towards cautiously bullish or below thirty-two and even towards thirty flat. Fibonacci is Twenty-Five and that is the "Must Hold" for silver to remain bullish.

Throwing all this aside, the joy people should be having for having more time to prepare for what is becoming 100% likely to occur in the destruction of fiat currency. These levels will not remain here for that long and although the lower support numbers going down to as low as $19.00 on the quarterly chart are thus moves within' the primary trend. The trend is higher and because the likelihood that fiat money will never become strong intrinsically as well as humans confidence in the dollar does not look good in the future. I don't think it should be debated if paying fiat dollars for silver at today's price levels to be a good or poor decision. I say this because anything that is real is what should be sought after. Whether there are better investments over silver for one person is definitely and should be up for debate. In some cases real estate or industrial equipment might be what is needed or stocking up on bic pens because of a possible pen shortage or massive spike in price. There are many options. I do think however, it is good to have a surplus of pens as they are good emergency items for writing stuff done.

Tuesday, June 28, 2011

06.28.2011

Hello, sorry I haven't been around on this blog for a while, but with the market being in this neutral waiting to form some sort of trend direction or some sort of news worthy event that is worth nothing, then I might as well take it easy on here. The market remains int he range from 33.00 to 39.00 and is at the bottom end of this currently. Fibonacci support of 33.58 has been holding very well, but the resistance has been holding much better showing bearish sentiment on the first move which would either spark selling to most likely below $29.00 to the next major level set at $26.00 or a failed move that will spark most likely an original fast move into the bull market trend. Of course you have more of this time consolidation and if you buy silver now because its cheap this is the time in comparison with previous prices on a simple numbers game. The numbers stated that in 1980 it was $50.00 for a brief moment on three different days and settled above $30.00. I also know that at the end of May it reached $50 again and yet is settling in the same areas. This is time is different, right? In, numbers I think (no). I can make a chart to compare these two time frames and can make it in a few minutes and will later on. Check below on the blog and I am guessing as I type this without looking at it or knowing its details that it has similar trends. What is different is currency values. Products are up substantially from 1980 and more so from the sixties. $50 in 1980 may not even be worth ten today. Therefore the numbers state that we could be at three dollar silver for that same time frame and three bucks was cheap back then.


If you are buying bullion silver and you are wondering if you should buy now with question marks as you scratch your head, you need to ask yourself why you are scratching your head. It could be fear that you will lose this gamble and the charts will never show over thirty again for many years. If that is the case, Really? I mean, Really? It could be because they are scared to liquidate it or sell it. If this is the case then you may need to spend some time and energy in the future to sell your silver. Don't take it to the dealer and get 90% on spot, rather you can network yourself with other people, online classifieds as there is many ways to get great deals. If someone is willing to buy silver eagles or maples for $39 from a dealer who will give you $34 then why not talk to the guy who wants to buy at $39 and offer $37 or $38. Yes, you can't say that at the dealer shop, but walk out with him/her when that person leaves and ask if you want to buy anymore and you should either get your sale or a possible sale in the future. The ones whom use strategies to get the best buys and sells at any time are going to win. It's important if you are going to go out of your way to buy gold/silver bullion that you get the best deal possible Therefore, if you are buying silver now, there should be no worry or concern of selling it right now. That time will come in the future. If your still scratching your head is it because you are tying up to much short term fiat. You don't want to have to liquidate and its not a great feeling when you are forced to liquidate this stuff for regular expenses, but that is why it is a safety net to begin with. However, if its because of the price being very high or wanting another dip then you have to ask yourself if you buy today at thirty-four per ounce and it goes down to twenty-nine would you buy again? If the answer is "yes" because you love the deals, then you buy now if you haven't recently and find the best deal you can. If you say "no" to buying at the lower price for most likely the reason that you won't have anything to buy more with, it might be right to scratch your head. I only know of two good ways to buy positions so that you can be effective at buying low and selling high. One of the ways is to find clear cut breakout signs which I have explained in the direction from the fifty as a good example. If you don't get in on this at the right time, you can very easily become late. Thankfully the super long term charts say we got a long ways to go before that is the case there. Another way to buy is to buy when its down to much. Gauging what is down to much is very hard and requires a lot of skill and hard work. One example is tell yourself. "I will buy when silver reaches $26.00 or very solid technical analysis breakout signs and as of now that is not even close." When this is the case then you stay in the sidelines. If you are a seasonal trader, then you buy on Thursday. Simple as that, you have to buy on Thursday. I'll explain more later this week why this to be the case.


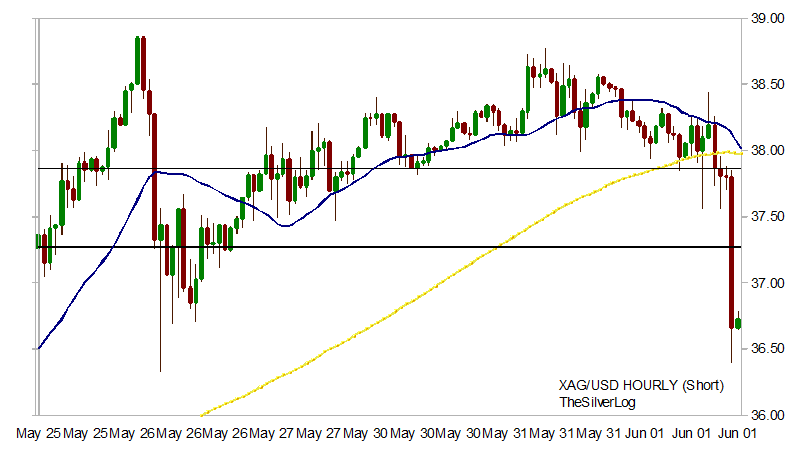
Images can be enlarged by clicking them. The image blow uses a front weighted moving average which puts more emphasize to the earlier periods. For an 18 period average by using a spreadsheet a formula would be needed like this:


Place Date in Column A, Open in B, High in C, Low in D and Close in E

For the Highs, place this in row 18 and put an equals sign to start it


(e18*18+e17*17+e16*16+e15*15+e14*14+e13*13+e12*12+e11*11+e10*10+e9*9+e8*8+e7*7+e6*6+e5*4+e4*3+e3*2+e2)/171
Lows
(d18*18+d17*17+d16*16+d15*15+d14*14+d13*13+d12*12+d11*11+d10*10+d9*9+d8*8+d7*7+d6*6+d5*4+d4*3+d3*2+d2)/171
Closes
(e18*18+e17*17+e16*16+e15*15+e14*14+e13*13+e12*12+e11*11+e10*10+e9*9+e8*8+e7*7+e6*6+e5*4+e4*3+e3*2+e2)/171

The number you divide it from is the sum of the average. For 18, the sum is 171 and the recent one is the highest number, the one level before then would be the second highest number all the way to one. This average may show more accuracy in the long run.


Wednesday, June 22, 2011

06.22.2011

Another day is over and the market remains above the fibonacci support of around $33.00 and below the fifty average around thirty-nine which has been the case for going on two months now. The fed spoke today, and I have no idea what they said. This is all a horse and pony show for myself because I know whats really going on behind the carpet. This fiat currency is a cancer in itself and we are trying to keep the cancer alive and everything we can to make the cancer happy? Is this what our lives have become? I refer to this fiat monetary system as very cancerous because of how it has destroyed many human beings. Debt is the most obvious situation, but even gambling addictions as well as crimes are related to this monetary system. Because guaranteed debt in itself is the number one direct shot towards the people, when I hear anything from bankers about what interest rates are all about then I don't want to know or participate in such an evil act. This is what it has all boiled to now as we have a boring market chart with sideways consolidation and I am out here ranting about stuff like this.


Monday, June 20, 2011

06.20.2011

This range can be shown well here as all the moving averages have moved sideways within' the thirty-three to thirty-nine range the price action is experiencing. I have pretty much let this chart be and let the moving averages calculate themselves out. These include the five, ten, twenty, fifty and one-hundred averages as well as a few VWAPs (Volume weighted average price) that are all in stable condition mode right now. The trend line which was resistance at the fifty dollar high at the end of April will have a higher percentage chance of being taken down, but for this to happen the market needs to get bullish fairly soon as it has thus far made a higher low above the January mark of $26.30. The longer this market stays in this boring tight range, then the bigger the breakout(down) usually tends to be and its closing in on two months of this sideways action currently. At least this has given those people no excuses for not getting into silver because of the market being too fast as well not getting a pullback. Many waited in the spring for one, and for those whom did congratulations as it has come into play with an approximation of four million seconds of time that has come off the clock over the last forty-seven days. That's a lot of time for people to think things through for reasons of getting into silver and/or getting out of currency.


DIRECTION FROM 50 DAY


This indicator I have been looking at for a while to determine entry points. Nothing has changed as far as the analysis is concerned as the direction from the highest point is higher than the lower point and this means sellers still in control. The 18% from the lows is the resistance level that I need to see this level clear out which is pretty much the same as the $39 level that is a massive level. This $39.00 will stay as the key mark unless the market makes significant new lows to buy on strength. The advantage on buying on strength is this allows any of this wild selling to occur first. If the market goes down to $25.00 then this level will move lower with the market lower for an entry point on strength. I would personally rather buy on weakness and that is my personal preference only.


ALL TIME FRAMES


Thursday, June 16, 2011

06.16.2011


12.5 grams of paper for over 6oz of silver and 1.15 grams of gold.

This also works to 12.5% under spot overall and considering I spent a nice chunk above spot on the gold the discount came from silver. It's an interesting life in trying to get the best prices possible and technical analysis can let you do this, whether you buy on strength for a breakout move or on the dip after significant selling. I would consider this a dip with significant selling as the price has declined sharply and we now enter the seventh week of lower prices for the long term charts. I already bought twice since the market fell below forty per ounce and today was the third. I didn't want to buy unless I could get a deal I was happy with. Part of winning this silver and gold trading game within' bullion is knowing how to barter. In 2009 I would give offers that I thought was fair for both of us and it was easy to barter with this salesmen. When silver was around $24.30 CAD last year he said if you buy at least four, I can sell Eagles for twenty-five and the only thing I regret that day was not grabbing a couple more at that price from what I got. That is the cheapest I have ever managed to get top bullion that cheap from spot. Long story short is that when you get to know the traders as well as secrets to getting great trades then deals can be had.

Today I was offered pre 63 USA half dollars with the average year at 1944 at 90% silver for ten fiat a coin. It takes seventeen halves to make six ounces of silver and that is exactly what I purchased. There was nothing fancy about these coins as they are pure scrap value with some history and small collectors value attached. I wanted to see which '64 halves he has as those are the coins I like and none available. Because of the indecision in silver right now, it makes it difficult to pay premium on silver right now as the play is to wait on a breakout past forty or a move below thirty, and my number is twenty-nine with fibonacci going as low as twenty-six. The premiums will be a lot more if they go to twenty-six in comparison to the January lows of the same level and more so as it was making new thirty year highs in 2010. Therefore, the premiums are here to stay at these price levels and will stay this way until the price is much higher. Because of my waiting on silver, I got a little bit of gold (1/20oz) and the premium was high with ninety. I may have got it for eighty-five. At least he threw in a 1967 Kennedy Half in really good condition for free.

When you get little bits here and there, then it makes the transaction easier. The sad part about this is somebody sold those seventeen silver coins to him and I can only guess that the price given was well below spot if he turned it for 20% under. I would guess seven a coin and forty percent under spot, but I don't know. If you are ever looking to sell your silver or gold then I don't advice selling it to the dealer. If the dealer is giving you seven dollars a unit for something and you know there people eager to pay ten to twelve then why sell for seven? Use strategy to find buyers and with online advertising and social networking it is not that hard these days to turn them relatively fast for fiat. I am buying with a sell strategy when gold and silver are used as not uncommon trade and most likely common trade. When gold and silver are recognized as money, then I have myself a little. Fiat is held by confidence and right now people are confident enough to keep fiat the primary currency. Key word is held. It's holding on like a thread. There is nothing that can be done to add new confidence in the paper trash and I am surprised the masses don't see it yet, but it's now getting close to the anytime based on a large awareness of currency and politics that will change this world. It's not easy to guess when this will be, but its obvious its happening. Based on this type of an event, gold and silver will hold value over other real things which also have value. Those real things are items people use in their day to day lives and therefore those whom have passed on gold and silver and stored up on products that has maintained value. These people also win and example of this may be someone whom bought thousands of winter coats in a cold part of the region and can sell these back for gold and silver and maybe do better. Some have said this with food, but no matter what it is you are investing in you need to be aware how the changes will transpire. One of my predictions is that of scales both small and big that can weigh money (metal), foods as well as drugs. Whether you agree with drugs or not, it's a potential customer if you buy many of these. The problem you have is technological advancement, where I can buy $5,000 worth of scales and store them and in two years from now when that is the big thing, we could have scales more advanced in so many ways to reduce the value of the ones you held. For every buyer there has to be a seller and because of this you may want to visualize ways of how you are planning on selling any investment you make. I'll try and do more rants like this on the blog every so often but not too often.


DIRECTION FROM FIFTY DAY


If this is your first time popping into the silverlog this chart shows how far the current price action is from the highest highs and lows this market has. The low was $32.30 area and the high was $49.80 area and within' exponential math the middle point is barely above $40.00 per ounce. As long as the price starts with a three then the sellers are in control over this market. I don't see much pressure overall because I know for sure that this ponzi system is collapsing and the daily movements mean nothing. However, it is only price that pays, and we can hypothetically assume that a meal at your favorite restaurant is worth the same as a silver dime, and unless you leave that dime as a tip to the server then then that silver dime is only worth ten cents to them. I may sound a little optimistic or pro silver when I say this, but I am confident that there will come a time where 999 rounds and scrap silver coins will be accepted very commonly in trade.


Wednesday, June 15, 2011

06.15.2011


The silver market ended the day at $35.82 and really stayed flat today as the broad market indices kept retracing lower. This current trading range is boring and I am going to stop focusing on the short term unless it becomes really important. It is important to be aware of the short term when looking for buy and sell signals. My outlook on this market is that we have been in a thirty year dip and therefore its very scary to sell any silver at this moment. I explained this a few weeks ago and will do another soon on dips, because on this chart, I would have had a hard time buying past $13.00 an ounce in 1979 because it was soaring n a spectacular bull market reaching areas never seen before as I wait for a pullback. The pullback occurred in 1980 and its been a thirty year pullback as the methodology that I use for buying pullbacks is to buy on the way down all the way up until it has a decent enough gain past the previous highs. In this case the gain should be over $100.00 and because I don't want to buy at the top of a market I would probably want to not be a buyer above $75.00. Once the market goes to $100.00 then the peak areas come into play as possible areas to sell on a technical level. On a fundamental level the currency is dying and I would rather sell my silver like I sell my fiat dollars today and that is to buy stuff with it when its accepted as cash and thus use the charts to buy more silver. I have not bought a single microgram of silver in about a month and I will stay on the sidelines until I can get a break below $30.00 or a move that shows a confirmation break above the $39.00

Tuesday, June 14, 2011

06.14.2011

MORE STUFF COMING OVER THE NEXT FEW HOURS (I HOPE)


DIRECTION FROM 50 DAY HIGH/LOW


Not much has changed since I last shown this image last week as for the buyers to get into control the direction from the low (orange line) needs to be above the direction from the high (blue line). Sellers still show the control and because this is a manipulated market then trading fundamentals do not work unless you count the manipulation as part of the fundamentals which is a smart move. However, because the powers that be have a policy of secrecy and harm amongst its citizens it can be very hard to see what they have planned. I say harm because they believe in a debt based system and because they control the monetary system the way that they do that is the reason I buy physical silver. I am waiting either for a confirmation breakout on the bullish side which will result in the orange line going higher than the blue line or a move below $30.00 per ounce.

DAILY CHART


Day Twenty-nine is now over as day thirty comes into play. This is the amount of days that silver has stayed and held above the key $33.58 fibonacci support level as well staying below the fifty day moving average that is flat between thirty-nine and forty per ounce. It's tough to say how long we will stay in this range because I don't know what the banking elite have planned, but if the market breaks support and moves to the next support level, then we will have some more panic amongst the silver community because they think the market is random or they think the market is free. The market is overall boring and until it breaks to one side or the other I will be less active on this channel.

WEEKLY CHART


Silver is holding on the eighteen period average of weekly lows like a thread now and this is not a good thing for those who want higher prices. It's a great thing if you are looking to buy more silver as it seems as if the market does not want to hold on. The thirty-two to thirty-three area will be most likely short and intermediate term support, but that also doesn't mean for this to be the case. After all the market is still in an indecisive direction phase and because it is below the declining five day average that might be bullish short-term. Normally it is the opposite that it is bearish when this is the case. It's tough to say because the market is not currently that easy to day trade and the only safe bet that I see when looking at these charts is exchanging fiat fake debt notes for physical silver for long term holdings. Final note on this paragraph is that as long as the market closes above the eighteen period of lows then I will keep the market is a cautiously bullish mode, but its getting very close for me to move this to neutral.


Monday, June 13, 2011

06.13.2011


Markets took a hit today as we move closer to the $33.58 key fibonacci support level. Still in the boring range, just now it is on the bottom end of the range and the prices for silver remain very cheap for the bullion. I have been busy and not able to update this page as much as I would have liked and today I have seemed to have stumbled upon a system that can pick stock winners and give exact buy and sell levels. I have never found a system that can work so easy, and it is currently in the tracking stages now. I am tracking the Dow30 component and I have done ten of them so far (one third) and this methodology has a 53-6 record and an average return of 2.54% over the last 20 months or so. I don't like the brokers of this paper game and shitcoins is another I am not too found of either. I will most likely sell this information on here since it does not to anything productive for society other than those whom can do something with the fiat money they make in a productive manner. I still want to test this out some more, but lets say fiboancci did it again :)

Thursday, June 9, 2011

06.09.2011


END OF DAY REPORT


The twenty-sixth day has been completed as we enter day twenty-seven for Friday. With the market currently trading $37.55 it is a little ways away from the fifty day moving average which is currently set at $39.32. It is not easy to tell which direction this range will break from and how long it will remain in this sideways consolidation. The longer a market trades sideways or through that of correcting through the time then the bigger the breakout or breakdown is going to be. As the days move in many longs and shorts get trapped in this market and if the market goes higher then this means that long positions will love their play to go long as well as other longs coming in as breakout signals appear as well as having shorts cover for a loss because the market breaks down. The same is true if it breaks lower that the shorts are happy with their gains and longs have to get out because its breaking down. This also can add selling pressure with people playing the trend. Currently the volume again was low as it was a hair lower than yesterdays record setting low volume once again making another two plus month low in volume on the phony shares (phony as in not real physical silver)

Shorter term the market is showing nice breakout signs. I am still not convinced as the intermediate term is looking more and more neutral every day. However, the chart shows us that the declining five day average was resistance on June sixth and then pulled back a small amount. Then the next day the on the seventh of June it got above the five average and was not able to breakout higher, however it did not breakdown either and the price has gotten above this average at the end of the day and found support at the five a few hours after the market opened today. What would be ideal for the market to keep rallying to at least $38.00 and then come back to the fibonacci level shown on the chart as support rather than resistance.


Wednesday, June 8, 2011

06.08.2011


END OF DAY REPORT


Intra day today the move happened as the New York markets were closing up shop and the spike higher resulted in fourteen minutes of time and gained thirty cents on the spot price and not quite one percent. This is all occurring within' a very neutral market priced wise based on the paper game. The paper game told us that only 2.2 million shares were traded in the final thirty minutes which is the lowest in at least two months, but definitely the lowest since Apr 12. This volume that surged todays rally looked huge on the chart (not shown here) as there was only 30,000 volume per minute until the last few moments containing an average of 90,000 in the final few moments. For the day there was 24.8 million total trade which is the lowest volume on SLV since April 8. The high for volume was 295 million on May 5 which was the big candle that has started this long range. The move on that day seen silver lose ten percent on the New York time frame after it had lost over 5% over night. The awareness for this ponzi scheme is growing which is a good thing, because these moves we see are not true market fundamentals for price movements towards commodities. Final point is the ranges that are boring and trade for so long tend to end in a huge break out/down. Today there was a very tight range on the 1m chart that spanned a little over an hour. It ended with a massive breakout. In the spring and summer of 2010 it was the same thing with the $17.50 to $19.50 range that broke out huge to the upside. Over the longer term we have this range from $33 to $39 that is setting up for the potential for a big breakout or breakdown.


HOURLY CHART


The indicator at the top of the screen shows the rate of ascent or decent on the five average. If its below the 0% line then it is declining and if its above the 0% then it is rising. It is currently at 0.0018985%. The move at 3pm to 4pm brought the five day average into positive territory and therefore its literally a rising five day moving average and realistically it is a flat average that is showing much indecision. This could be the time where the market breaks away from the five day average and thus resuming the intermediate bull market and it is very hard to tell right now. What would be ideal would be a move to the upper fibonacci level and then pull back to where previous resistance was found roughly around $36.80 to $37.00. Another ideal way would be for the fibonacci to be little to no resistance and break out towards $38.00 and the find support at the fibonacci line rather than resistance. Again it is difficult to say where we are heading in the short term as we enter day 26 of this boring volatile range.

RATE OF ASCENT/DESCENT on 5 day avg


Two main things I find interesting on this chart. The first is how obvious the selling in May was not to the normal and the only time within' the last year that we have had a move of these grand proportions. In fact this would be close to the moves of 2008 selling which I will try and get out later on for the longer term view of this chart. The other thing that I notice is that there has not been a big up push on this chart. The entire run always seems to show it tops at 0.075% and a couple times it went above 0.1%. With the move lower reaching the proportions of -0.25% then a move to the positive level of 0.25% would mark 20-30% gains in less than one week period. Those days I feel are coming (probably later this year), but definitely not guaranteed. SLV ended the day with a declining five day average where as the actual spot price ended the same time frame of 4pm EST with a rising five day average. The reason for this is because the comex average shown above tracks all time frames and the SLV only for their own and this tells us over the last five days that the market has done worse in USA from 0930 to 1600 New York time compared to the off hours.


Long term rate of ascent


This chart is meant to go in radio waves type format or like energy types of charts by the nature of how the markets move and the way they are calculated. Chart is calculated by taking the average of the High, Low & Close and then taking its rate of increase from week to week levels. This image shows us that this one week selling that occurred six weeks ago was the largest one that this market has endured this decade over a short period of time. The move as of yet has not taken out the intensity of 2008 because sixty percent was taken off the high price and so far only a third or thirty-three percent has been the decline. These moves are not normal to occur and because of the way our banking system is setup this shows me more signs of the currency collapsing as a precursor event. It will probably only take one big spike to the upside that will set us to the next level and maybe two total as the dollar collapses. Finding the when silver will break into higher levels is hard to do, but what isn't hard is to use a chart like this as a gauge for such with it making new highs.

This chart shows the last few years a little bit better and the difference from 2008 was how it was at the -10% area a few times and only once here thus far. Since the 2008 market crashed this is in fact the first time its had a real break below -5% price differential. I used this chart and formula because its the easiest way to see how the rate of ascents/descents would have looked on a long term level and this does a decent job as such.


Tuesday, June 7, 2011

06.07.2011


POST MARKET UPDATE


The market is currently having battle with the five day moving average and the one day average has crossed through with the declining five day. Just because the five day is declining does not mean the market is in an intermediate term down trend because it needs to confirm the move going lower by breaking below $35.00. If it stays above this level then the market will move to a neutral state instead. If the five day average starts to move higher with the market going up, then this will cause a bear trap or that of a failed move by breaking below the five at the start of the month and not reversing the trend. Often times from failed moves can create a fast move in the opposite direction. The big level is the Fibonacci mark at $37.32 which is what is needed to make the selling on this chart to become a failure and blue skies ahead (for now) as the market inches closer to that $39.00 level. All this is happening within' the range for five weeks between $33 and $39 area and I find this market to be that of boring trading within' this range, but it has given many people some time to think about their fiat debt notes and whether they are ready to invest in the real physical metal (Not the paper crap).


1979 COMPARISON UPDATE


The comparison chart has managed to go well below the levels from 1979 after the same amount of days on the breakout level and I will continue to focus on this chart until there is no need to anymore either because it has fully compared itself in the time required with 1979 or the comparison flat out dies. Just because it is well below the level back then does not mean the comparison is dead because the market then traded sideways after the same amount of days as it is now. I often wonder if the market is not free then how will the price manage to go these highs levels and it confuses me the more that I think of this. I realize that its the bankers that control the market and they want to suppress the price to keep their fiat dollars alive and for now I'll just play the song "You can't always get what you want" by the Rolling Stones and leave it at that. I realize its the people on this planet that need to lose faith in the currency and that is what my end game is all about.

Monday, June 6, 2011

06.06.2011

Blogger will not allow me to upload this chart right now which is for the intra day markets. It can be found here


END OF DAY REPORT


Todays rally was met with resistance at the five day moving average and it was its first resistance touch since it has declined. It did find support at the significant fibonacci level and now the short term outlook is very cloudy and neutral. If the five day average is not resistance and a new leg lower than this will bring us a failed move of falling below this five average which should spark a move to the huge $39.00 level as well as the fifty day moving average. If this is resistance however and it makes new legs lower than the next level is the $33.58 area which has been support now on two occasions. The market has also having a head and shoulder pattern (one shoulder) as it might make a lower high on the next move and thus for a right shoulder. The name is irrelevant and the reason why it works well or what the pattern is trying to show is that the support level at $36.50 and it would be devastating if this level gets nullified.


15M Line Chart


This chart I look at once a week or so and today is one of these days. The trend line which increases 0.6% each trading day that started back during the beginning of this rally is my line used to define parabolic moves. I need to see this level have a confirmed breakout of this level for me to say, "Yup the dollar is on verge of a collapse and we are not much longer!" However, that is not the case now when we are currently trading around $36.50 and the trend line is at $57.94 right now and a sixty percent up move is required just to test this level. A confirmed move means it has ripped through the level with massive gains above it (at least 25%)or to find a breakout signal which is often times breaking the level and find support at the line and then showing breakout signals. Of course this is a long time away, but if and when this happens I will report this to be such the case. For now the range for $33.58 and $39.40 is the big picture and a break below could create fast moves as the volatility is here and I don't think we will stay in this range too much longer and it could be an up break, however the longer we trade sideways the larger the breakouts usually tend to be.


Direction from fifty day High/Low


It seems 25% will be the cross level and at 25% this would translate to $41.00 as an approximative area. The overall range has the market stuck between 33 and 39 and the levels are currently in this direction. I would once again point out that it is not normal to go from a time frame where the market makes a new fifty day high and then moments later makes a new fifty day low. That is what has happened and the sellers are in control currently on this manipulated market and if they could manipulate to go down to this level, then they can sure as heck bring it down another leg lower. The support on this chart was found at eight percent and this translates to around $34.75 as important level.

Friday, June 3, 2011

06.03.2011


END OF DAY REPORT


It is funny that only the few seconds of technical analysis that was given in part two of Thursday's video actually came true. That was "maybe we come down a little more so that the Fibonacci lines will match up" and that happened perfectly when the market bottomed today at $35.10. It seems like it is too much of a co-incidence that these fibonacci levels match up well with previous support, resistance and other key areas rather than random spots. The resistance met today from the morning rally was met at that key $36.50 level and if it can manage to make a higher low then taking this mark will be expected. It has now been over a hair over a month in time since the short term major panic crash setup most likely by the banking elite and it has consolidated for a decent amount of time. I will continue to make and follow these charts if they are helping. Don't tell too many people, but the price movements are not real and there are still many (if not all of them) that are selling their 999 silver for only a small percentage above the price the government tells us it is which is an extremely free market (Free for the powers that be to manipulate). The revolution it growing stronger and the video below is from south park which had a great skit that i thought was funny. There is swearing in this video.


Thursday, June 2, 2011

06.02.2011


2245PM EST UPDATE


This market currently is right at the eighteen day average of closes and the average of lows is currently at $35.18 giving it more reason why that level is so important to be held. I have added what looks close to that of bollinger bands which I will explain how I calculate them at the end of this mini article. This is designed to find areas where the market is oversold or overbought. Bollinger bands are great and all, but unless I can calculate them myself and understand what it's meaning really is then I refuse to put this within' part of the analysis. Currently the low end of this band is right below $31 and not shown yet on this chart, but on the way down it crashed through this level which is set so that if it makes it to anyone of the bands it has done very well as I have used volatility to help determine how high or low these bands should go. The method that I used to calculate this is I find the average volatile moves over the last eighteen periods which is the calculation of (High-Low)/Low. Therefore the upper band is triple the volatility plus one multiply the average of highs. Therefore right now the average is $36.95 and the average volatility over the last eighteen days is currently at 5.1% and there triple this number to 15.32% and 36.95 x 1.1532 is $42.61 and this gives me the band level. For the lower side I take the opposite percent level for a negative and the opposite of 15.32% is 13.28% to the upside and take that percentage off the average of lows set at $35.18 which is calculated to around $30.50.


DAY 21 OF SIDEWAYS MOVEMENTS


The total amount of shares that has traded on SLV since the start of May is 2.4 billion shares. This is pretty much 2.4 billion ounces because one share of SLV is designed to be in or around an ounce of silver. It takes us three years to mine this much and yet it is traded over the last few days. It's easy for the high frequency traders which is supercomputers without a soul of consciousness executing trades faster than any human could even come close to thinking and this is all fine with the people? After all on May 6, 2010 the stock market suffered a flash crash and the people were all fine with this and I guess those who got screwed over by it either sucked it up and didn't say anything and even if they did say anything it would have not got them far. For the dollar to collapse and for humans to get freedoms we desire then it is up to us to do something about it. If you are sitting back on your sofa waiting for the government to fix the problems, then that is not very productive and if anything counter productive. It's a fairly simple to task to do and the easiest part of this is to tell the banks to Fv(k off and this is done by not playing their casino game of equity trading. This is done by not using their service for a safe and closing the accounts completely or putting the absolute bear minimum in their and when you get paid, then send email transfer for some silver or withdraw the currency from the bank machine. There are so many things that can be done, and this is the biggest one. I am not a financial advisor but you would be hard pressed to find one that suggest the same thing that I am here by saying goodbye to the debt system. Another thing I suggest that a financial advisor will not is to wake and help as many people that you can with information on currency and government policies. This could be on 911 being an inside job, how money is created, their policy on chem-trails and Monsanto as well as the pharmacy/fluoride issue. There is so many different topics that need to be addressed and it seems more clear to me that its the people that are going to be the ones to collapse the currency! Why would the government want to collapse the dollar? This is their tool that is used to keep us enslaved and what they are trying to hold on to (maybe a thread).


DIRECTION FROM 50 DAY HIGH/LOW


It looks as if we have established a resistance level around 18%. The last two great buying opportunities came when it was breaking 10% and it won't be the case here because of the higher volatility requires a bigger push. The blue line is still above the orange one and what would be nice is if this could consolidate from 10-20% for a few days or a week and then finally break past the 20% range where the blue line will go below the orange one and thus set another buying opportunity. The fact that the market made a 50 day high and then a few days later made a 50 day low is not normal market action and I have tried to not make it a secret that the paper trading game is a little bit shady.

Wednesday, June 1, 2011

06.01.2011


23:17pm EST UPDATE


The five day moving average is now declining but will not consider this a bear market until the support level at 36.25 with a confirmed breakdown. If it holds this level then this will either mean the market to go neutral and thus the five day average will trade sideways as well or it will get back above the five and reverse back to the upside and thus making todays selling a failed move technically speaking. Still kind of sickening that we have to rely on a market that is so heavily manipulated or far free having free price movements. In my opinion the only way this should be traded, is by trading silver. This means to buy you either take the lowest ask price offered or put a bid order in yourself and wait. If you want to sell then choose the bid price offered or put an ask order in and make sure you have the silver in some sort of NON FRACTIONAL bank that has the silver or you can deliver to the bank. When you consider we have many millions traded per day the same silver can be swapped dozens of times per day, assuming of course it is real silver. High Frequency trading can buy at 37.20 and sell it back at 37.28 two minutes later and then make these two or five or short trades hundreds of times per day. This is not productive for society at all in my opinion however if people are still interested in buying/selling at these levels I will continue to update these charts as people whom are selling close to spot are doing so and thus they are complying with the price controls that controls the world financial system. Thats all I got for tonight. Be back late Thursday morning either on the blog and/or youtube.


END OF DAY REPORT - Article below will explain a lot of the action, but gold and silver traded different and this move was specific towards the silver market today as silver got crushed as gold went up today. Don't ya love this manipulation? We'll you don't have to, but the corruption of dollar manipulation is the reason I buy the physical. Next update will be later tonight between 11pm and 12pm est.


UPDATE 405 EST


No support was found at the fibonacci mark and it kept going lower. This doesn't say fibonacci was a failure other then realizing from adjusting to the message of the market that the failure to not find support at this level created a fast move to thus make a double top formation. It really isn't official until it can break below the key support mark, but when you look at todays volume with SLV it seems something was going on because at 3:24pm the volume brought 250,000 which isn't that large, but it was the highest it had seen in about an hour but at 3:38pm there was 2.7 Million volume (or 2.7 million ounces of silver) was dumped and the SLV shares dropped forty cents in that minute alone and it followed with more selling and high volume. That hour had a 4% move top to bottom as the silver price lost over a dollar. Volume overall was still light with only a little over fifty million ounces being traded (paper silver of course) and of that 13.5 million was traded in the last thirty minutes alone from 3:30 to 4:00pm. As far as I know, APMEX and other sites are accepting price controls for silver, however they do charge an x% higher from what the government tells them to sell it for and as I type this at 4:14pm it is $36.74.


UPDATE 1230PM EST


Normally the market is really volatile from around 6am to 10am eastern time and then it cools off a little bit and today is quite the opposite. At 10:01 the movements got really wild as the market sunk fast and furious which was followed by a huge lift higher and yet another big move lower. It's very tough to say what is going on now as the five day average test is still in process. The market has been experiencing lower volatility over the last few days and this move is most likely yet another precursor to something else. The difference top to bottom over the last couple hours or so is from $37.55 to $38.44 or that of 89 cents. The move is a little over two percent and is still tame from what he had encountered a few weeks ago. After all the average move during a sixty minute period was two percent and therefore still peanuts to what we have been finding. I figured the chances were good that a fifty day test would occur before a breakdown of the five and this can still be the case because the five has been holding the early stages of the test and that is very normal. The five day average is rising and its pretty much at the level now showing cautious and bullish. The fifty day average is flat and below it and showing neutral action being pretty close to its level and the two hundred average is rising and has not been tested or touched in around nine months. This makes it very hard to get a clear direction right now and especially when the market is driven within' fraudulent methods. I was about 70-75% confident on the five and that has been reduced to 65-70% because its not uncommon for moves like this to occur where it can go above and below a key level a few times before it breaks away either up or down.