

 Nice decent open to the March 21 session. I was not happy to see its norm and for a gap higher as it does not make sense to me why a market should gap higher or lower like this if a market is closed. My chart shows no gap differences, but the move was about one percent on oil and silver up. Obviously some trading was done when markets were supposed to be closed. I think it would be better if the market did remain closed and it gaps open at 6pm New York time on Sunday night and it opens exactly where it closed. There might be fast volatility to start the day off, but at least we can be thankful for high frequency trading handling these paper trades and keep our full sarcastic trust that the comex will deliver all silver/gold requested as well GLD/SLV holders investing in an ETF that is fully backed by real metals.
Update - 4:08pm EST - Market is breaking out after the USA markets close for the public. This has been normal on Friday's where the last hour from 4pm to 5pm EST the market just surges to the upside. This rally is a break of a symmetrical triangle that has been in tact all day today and thus making almost every time frame to be in a solid bullish state and every time frame is bullish to one degree or another as of 4:09pm. Silver is at 35.18 and at levels not seen in six hours. The only people in 31 years in a losing position are those whom bought at the top and silver is only four percent away from this level.
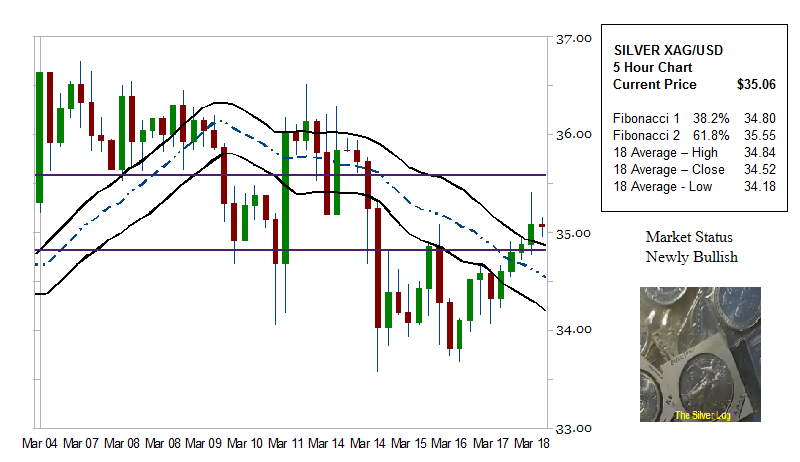 Five hour chart for silver and a review of every (or most) time frames will be on this weekends video. The daily chart which is already bullish is now seeing its more shorter term time frame now move bullish. This is the 1/5th day pretty much as its the 5 hour data. With 24 hours in a day, I am not entirely sure. Within' this pattern the market is getting above those key moving averages. The moving averages are declining and this will change in the next candle as it will start to rise on the very next tick. When you are newly bullish you are also cautiously bullish which means you are in a stage where it's not that difficult to have a few moves to change the direction to neutral or bearish.
Update 2:45 - Check this video out. Gold is now available at ATM's
 I have called this formation which ended the previous hour candle in a cat tail formation. Others call it a hammer. I guess this happens when you are self taught as I am for technical analysis. This cat tail/hammer is where you close near your open with a decent down tick as shown here. As of 2:22pm EST on the reporting of this formation the outcome is a symmetrical triangle on the 5 and 10 minute charts and down to 35.09. I give this a 75%+ shot on this to have another leg higher on this chart and extension on the 18 period averages. Be back later on.
Nice post Derrick! Always like your point of view on the markets... Have a good one!
ReplyDelete