

Update 23:27 EST - Considering we are at high volatility over the last few days it is interesting to see that in the last ten hours or so the movements top to bottom are only 66 cents or a shade over one percent. Calm before the storm? What will the storm be? Move to 43 and lower or move to 53 and higher? I think 80%+ likelihood of the storm being upside.
 I was four days late reporting that on Sunday night when the Silver market approached $50.00 per ounce it hit the trend line and bounced off of it. Not one single so called analyst figured this out in my opinion and it wasn't stated on any other silver channel that I know of. I kinda wonder if what I am doing here is wrong. If Jim Cramer is not talking about resistance level or the 685% fibonacci marks I don't think I am doing the right thing by coming into the blogosphere and showing all these weird analysis points. Maybe I should just stick to focusing in on the Stochastics and say to short every time that reading is above 80. Also another thing is that the Silver (priced in gold) got over 1,000 today for the second time since Sunday night. I wonder how many analysts are stating that a gram of gold is worth the same as an ounce of silver. Very interesting I must say. The bottom line is this: I am confident in my methodology and am surprised that some things like the Fibonacci upside calculations do not spread out to the silver technical analysis community. Being a hermit from the trading community maybe it is and I don't know.
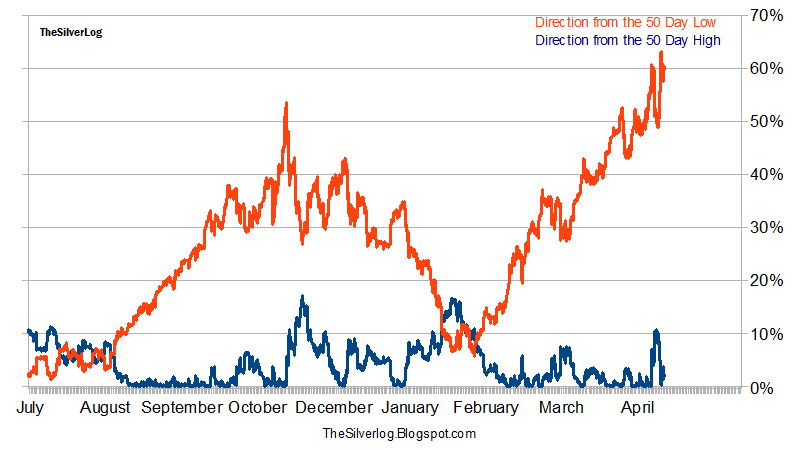 I could make a confident guess that I am only the one talking about this chart as well as some of you people reading or downloading some of my images. Some people may like to short when the lovely indicator has a reading above 80 and myself I want to see the direction the fifty day high come off its lows and then consolidate and the manifest a pattern to show the breakout. The direction from the fifty low did this both times and on both occasions I pointed this on the blog. Now we are seeing this just take off to oblivion and reduce the size in comparison to the move from 2010. The market is stronger after that major lift and because the market had a long four years of sideways consolidation from 2006 to 2010 this gives reason to show why this is happening as this gained the bulls energy needed for the move. This may sound like hogwash, but from my research the longer markets move sideways then the larger breakouts/downs tend to be. Don't know how much energy is left, but I wouldn't step in front of a train.
 Thursday is over and we move to the final trading day of the week and the month of April. It is also the "Friday Trade" which have been very interesting to say the least. Last Friday had a curve-ball by actually having a trading day and Friday has not had a losing day in a few months. Generally speaking the end of the session on Friday is where it gets hot right up to the close. I really would be surprised if we don't break out here. I hate going by instinct or by feeling that $50 was not going to be much resistance and that we would shoot up to the $75 area very fast. The charts are shouting either we are just starting to bring in an intermediate term top or we are just starting parabolic upside moves. The volume on the market is heavy and parabolic up moves that have 20% kind of days would most likely include massive volume with the increase of volume leading up to the event. Today's volume on SLV indicates that something big is coming our way. Final note is that I have not followed much MSM and am not aware on what they are saying about Silver and I happened to come across a gold bubble article from 2010 I want to share with you. That will come after 7pm EST.
 People have often asked what this volatility means and it should either be an intermediate term top or that of a volatile push higher. I still need to cover more on this later on as the moves that would occur in an hour when its parabolic to the upside would be inequivalent to the 4% or 5% either up or down. Still indecisive yet which it is going to be and would fence towards parabolic up move as the best probability. Because of these movements it is not a surprise for these massive up spikes and if (or when) they occur what should fall out from this are wild swings both up and down.
1250PM EST UPDATE - This volatile market remains as such as the moves that occur over a short period of time (5-60 minutes) can be quite large. small intraday corrections that used to be 0.5% are now 1.5% or even 2% corrections. The following cycles show this well
1131 - $49.53
1147 - $48.14 (-2.81%)
1150 - $48.73 (+1.22%)
1206 - $48.12 (-1.25%)
1232 - $49.01 (+1.85%)
1326 - $47.27 (-3.55%)
1424 - Current $48.72
I think $48.11 may hit the next wave cycle lower if we top anywhere near here. This section is over for the day and the next blog update will come before 4pm est.
1130AM EST UDPATE - Market continues to rally hard as it is now two percent away from all time highs. I think the highs are $50.50 and not sure, but I feel I may hear the words of silver up too much or when its all time high for the minute, hour, day, week, month, quarter, all time then I want to sell and/or sell short. Therefore the paramaters I am going to use here is whenever silver makes a new all time high and new ten minute high then I will plug the level in with a four percent rule. If it's up four percent it is closed for a win and down 4% it is closed for a loss and track to see how they do. Maybe it will only be one entry and its a huge winner. I don't think so, but time will only tell. I am taking this rally very seriously right now.
 Due to storm conditions on my end the internet speed is not that great today and if I upload today, it most likely will be a 40-60 second video. I'll wait and see if something good comes up, but for now it will be updating every hour or two on the blog if the internet even holds up and normally it can handle the worst of the wind and thunderstorms. As far as the market is concerned the 61.8% level at around 47.85 to 47.90 was support rather than resistance. This was then support showing that the selling from the very early Monday AM peak to the low breaking $45 was a failure. Often times from failed moves creates fast moves in the other direction (thank you Brian Shannon, your awesome). The fibonacci math would state that $53.00 is the next price objective on the break of $50.00. This is a very powerful level of resistance on so many ways when you encounter the psychological aspect of it as one. The second is the 1980 all time nominal highs. The $48.36 fibonacci level is also in this mix and when you look at this chart and draw a line in the area of $48.36 what do you see? The answer to this question seems to be most certainly that this level was amazing resistance that corrected purely through time for a few hours. However, before we talk about $53.00 what is important on the intermediate term is not to make a higher high but rather establish a higher low. The last low was $44.66 and therefore sell offs to above $46.00 is still considered bullish. Final topic is that because this failed move (if it stays failed and they usually do) based on the nature of how aggressive the failed move played out, logic should state that the fast move would be aggressive in nature.
hi,im gauri,i dint quite get you.u mean that after silver makes a new high then if its up by 4 percent then its going to make newer highs and if it makes a 4 percent downmove then v can see a big correction.am i right.plz do help me know your views as i am short in silver from 40 dollars level
ReplyDelete@rashmi
ReplyDeleteI really can't say too much rashmi as the stop loss was established above 42.50 for the 40 level as well as having a great opportunity at 47 to 45 on the way down earlier this week. Your current wager is against a strong trend that has started a parabolic uprise. Also by playing four percent gains means stops at 2% and thus even around 41.00. By holding on to a short at $40.00 for a risk of over 20% means you are expecting silver to drop from $40 to at least below $32.00.
everybody it seems keep saying parabolic, like y=x^2 means anything in this context.
ReplyDeleteIf they are reffering to the 1979 decade long chart, having a smiley face, then yes....it might kinda look like one. Or is this some lingo-talk about "extreme bullishness" that got the math out of hand?
cause, as a mathematician, I don't see any parabolas anywhere in this technical analysis..:)
Maybe there's something I don't understand.
Go-silver-Go.